External Memory Interfaces Intel® Agilex™ FPGA IP User Guide
A newer version of this document is available. Customers should click here to go to the newest version.
11.7.4.4. Calibration Report Tab
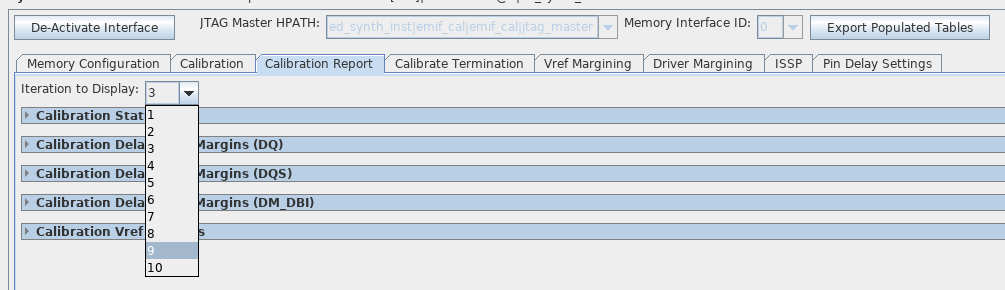
Choosing the Iteration to View
You may choose to view the Status, Delay Settings, or Margins reports for any of the most recent calibration iterations initiated through the toolkit. To select the iteration to view, select from the Iteration to Display dropdown menu.
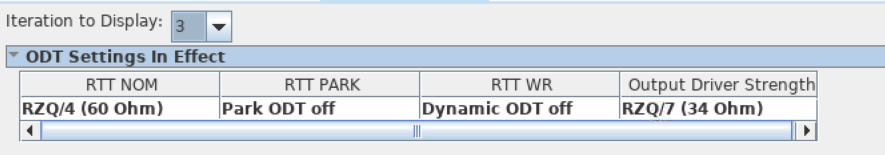
ODT Settings in Effect
This report shows the ODT settings for the latest calibration.
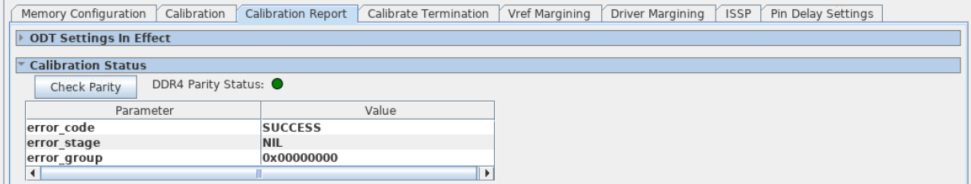
Calibration Status Report
The Calibration Status Report displays the calibration status and memory parity (ALERT_N) status. If a failure occurs, this report shows the first stage of calibration that failed, as well as the data groups that failed at this stage. Memory parity status observed during calibration is shown for DDR4 interfaces if ISSPs are enabled in the design. The calibration status report window contains a status indicator for memory parity and a button that allows you to reread memory parity status.
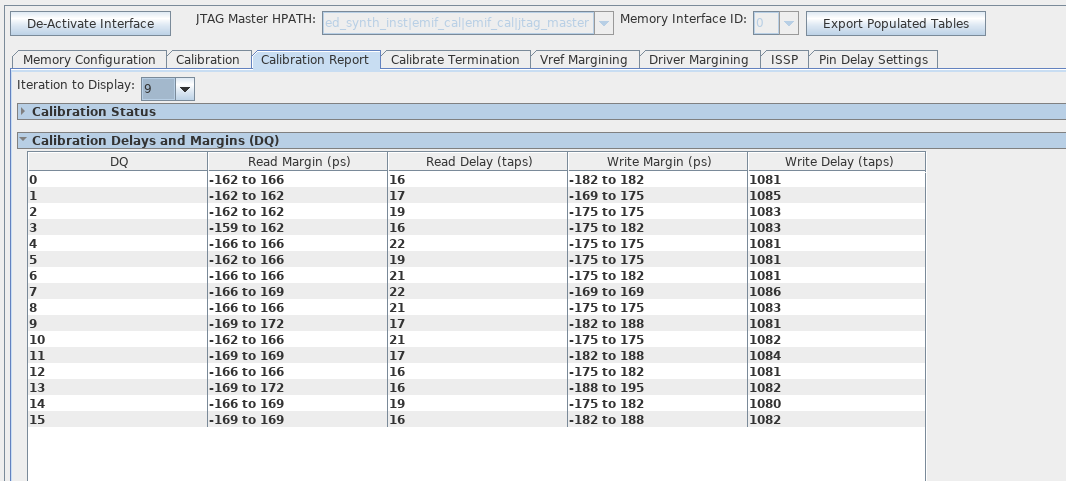
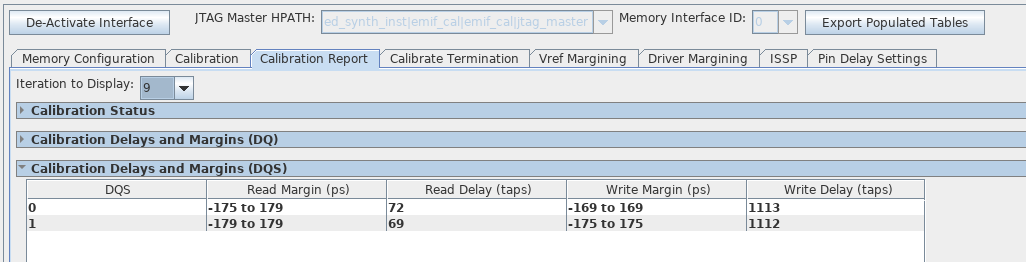
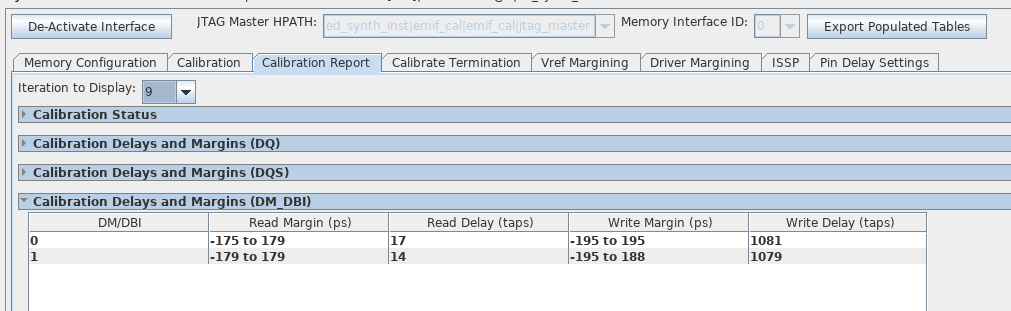
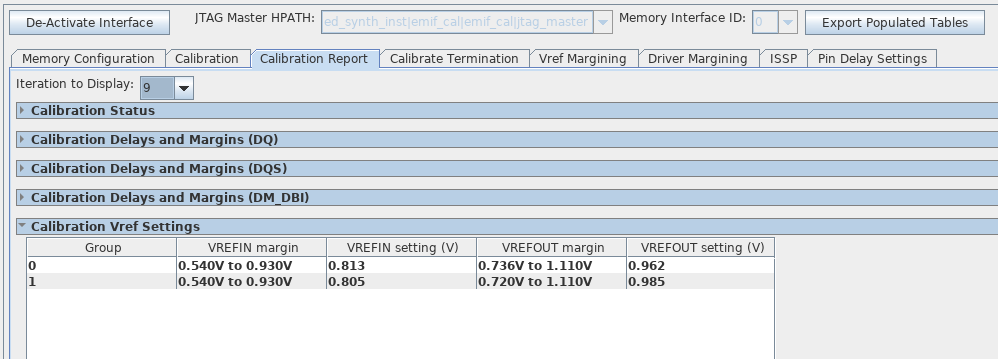
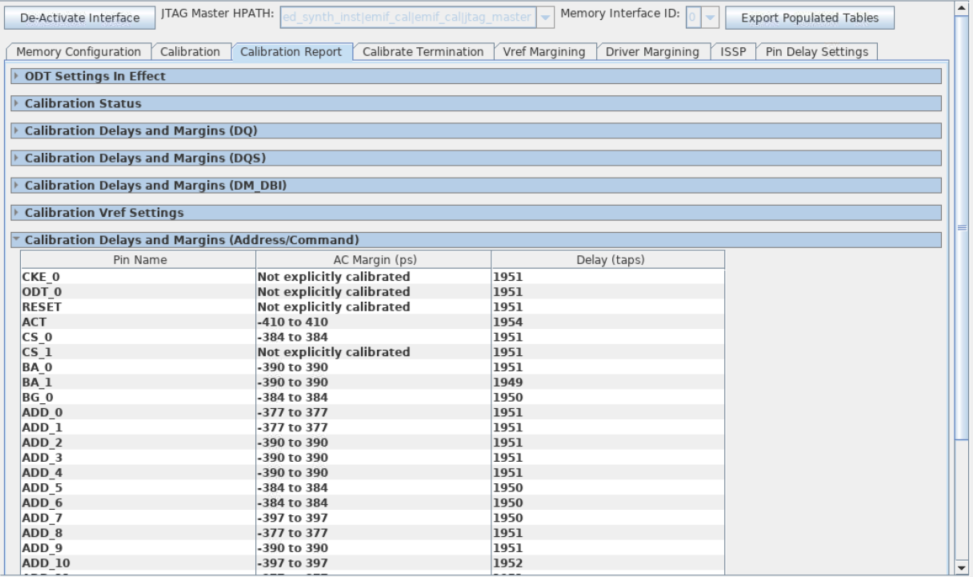
Calibration Delays and Margins Reports
These reports provide detailed information about the margins observed during calibration, and the settings applied on the calibration bus during calibration. To view the margins, click on the respective section for DQ, DQS, DM_DBI, Vref , or Address/Command.
These reports can also be viewed in a graphical format. Refer to Viewing Reports Graphically in the Eye Viewer.