Intel Agilex® 7 M-Series FPGA Network-on-Chip (NoC) User Guide
A newer version of this document is available. Customers should click here to go to the newest version.
3.7.1. Fitter NoC Reports
The Compilation Report includes the NoC Connectivity Report and the NoC Performance Report in the Plan Stage section of the Fitter Report.
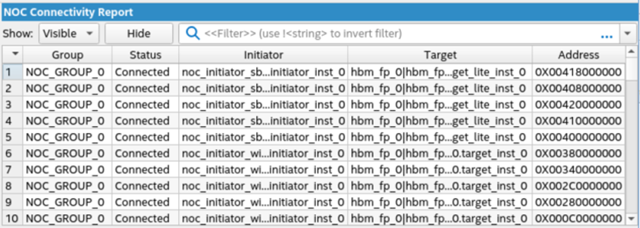
The NoC Connectivity Report provides information on connections between NoC initiators and targets in the implemented design, and their associated base addresses. Use this report to verify that the implementation of connection and attribute assignments are correct.
Figure 51. Sample NoC Connectivity Report shows an example NoC Connectivity Report. The table in this report contains a row for each initiator to target connection. Additional rows may report any unconnected NoC elements. The following columns report data:
- Group—displays the connection's NoC group assignment.
- Status—displays whether the row is for connected or unconnected elements.
- Initiator—lists the NoC initiator elements.
- Target—lists the NoC target elements.
- Address—displays the hexadecimal base address for each connection
Fitter NoC Performance Report
The Fitter NoC Performance report uses actual design clock frequencies determined during bandwidth analysis to report performance data. This report is similar to the NoC Performance Report that the Interface Planner generates. However, the Interface Planner report uses only estimated design clock frequencies. The Fitter NoC Performance report shows the maximum possible bandwidth and the total of requested bandwidth for the congested path. This report indicates whether you can achieve the requested bandwidth, or whether the connection is congested; and provides information about the cause of the congestion. The cause of congestion is an indication of where the congestion occurs, and which other connections contribute to that congestion.
The following are some possible causes of congestion:
- The sum of bandwidth that you specified for all connections (read and write combined) entering a target exceeds the target bandwidth limit.
- The sum of bandwidth that you specified for all connections leaving an initiator exceeds the initiator bandwidth limit.
- The sum of connections on any node in the body of the NoC exceeds the bandwidth capability of that element in the NoC.
- A connection shares any node in the NoC with another connection that has congestion. In other words, slower connection B traffic delays the connection A traffic.
- Over-saturation of the horizontal bandwidth available in the NoC. This condition is the result of multiple initiator to target connections requesting bandwidth in the same direction through a horizontal section of the NoC. The NoC Performance Report message reports the congested segments. You can adjust initiator placement to alleviate congestion. For important considerations when choosing initiator interface bridge placement, refer to the tables in Horizontal Bandwidth Considerations and High-Speed Interconnect NoC Locations in Interface Planner to translate location choices into physical placements.
For example, if the sum of all bandwidth requirements through a particular initiator is greater than the bandwidth that the initiator can support, based on the data width and operating frequency of its AXI4 interface. To avoid this problem, either reduce bandwidth requirements or increase bandwidth capability. The NoC Performance Report Messages show: