4.4.11. The Power Monitor
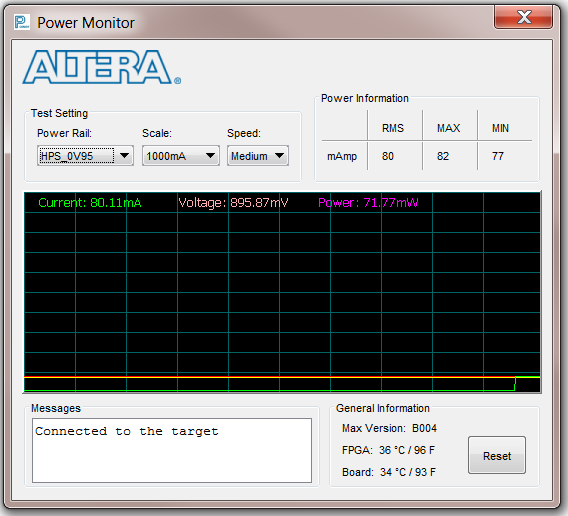
Test Settings
Displays the following controls:Power Rail: Indicates the currently-selected power rail. After selecting the desired rail, click Reset to refresh the screen with updated board readings.
Scale: Specifies the amount to scale the power graph. Select a smaller number to zoom in to see finer detail. Select a larger number to zoom out to see the entire range of recorded values.
Speed: Specifies how often to refresh the graph.
Power Information
Displays root-mean-square (RMS) current, maximum, and minimum numerical power readings in mA.
Graph
Displays the mA power consumption of your board over time. The green line indicates the current value. The red line indicates the maximum value read since the last reset. The yellow line indicates the minimum value read since the last reset.
General Information
Displays MAX V version and current temperature of the FPGA and board.
Reset
Clears the graph, resets the minimum and maximum values, and restarts the Power Monitor.