P-Tile Avalon® Streaming Intel® FPGA IP for PCI Express* User Guide
A newer version of this document is available. Customers should click here to go to the newest version.
7.2.5. Using the P-Tile Link Inspector
The Link Inspector is found under the PCIe Link Inspector tab after opening the Debug Toolkit.
The Link Inspector is enabled by default when the Enable Debug Toolkit is enabled. It tracks up to 1024 state transitions with the capability to dump them into a file.
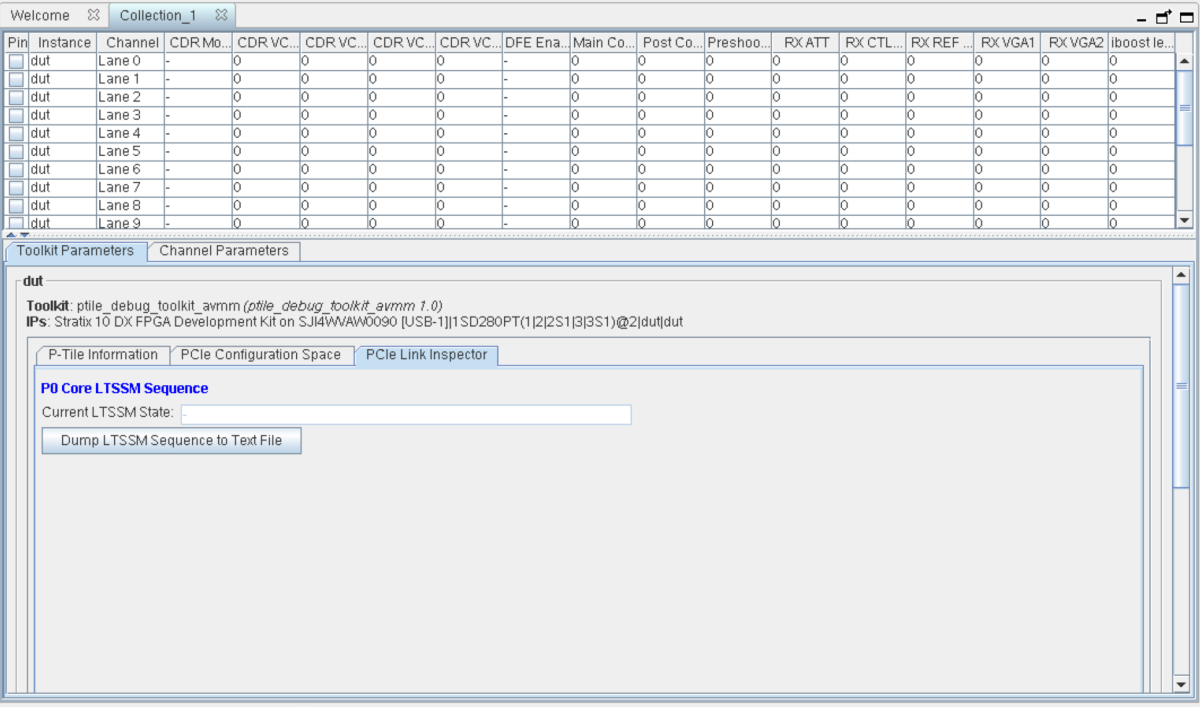
When the Dump LTSSM Sequence to Text File button is initially clicked, a text file (ltssm_sequence_dump_p*.txt) with the LTSSM information is created in the location from where the System Console window is opened. Depending on the PCIe topology, there can be up to four text files. Subsequent LTSSM sequence dumps will append to the respective files.
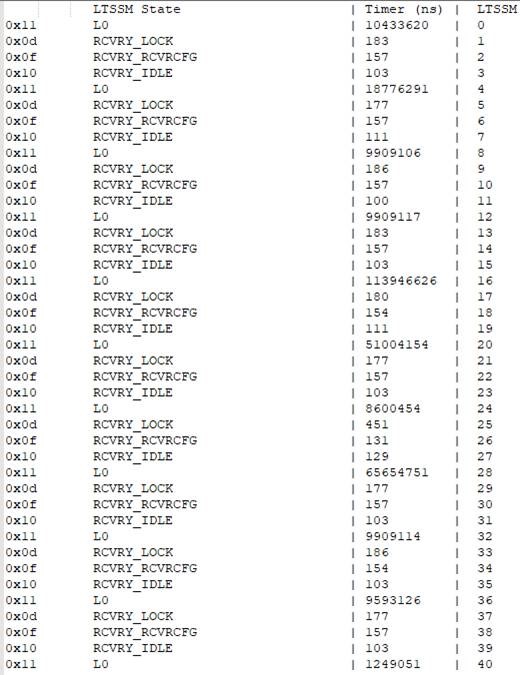
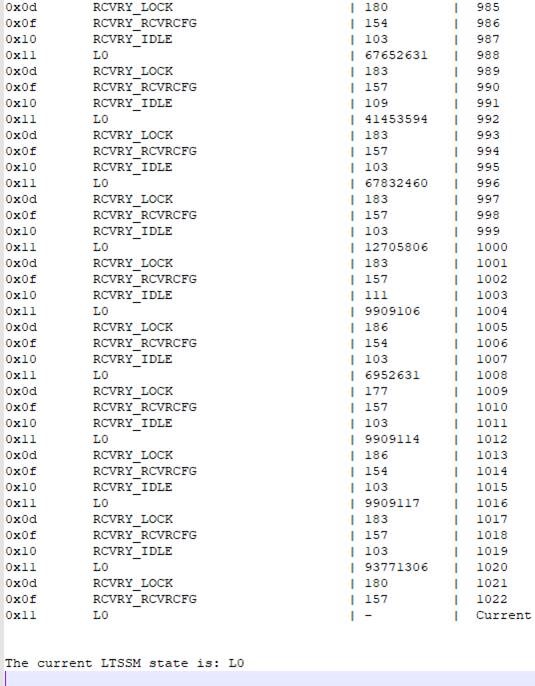
Each LTSSM monitor has a FIFO storing the time values and captured LTSSM states. When you choose to dump out the LTSSM states, reads are dependent on the FIFO elements and will empty out the FIFO.
The Link Inspector only writes to its FIFO if there is a state transition. In cases where the link is stable in L0, there will be no write and hence no text file will be dumped.
When you want to dump the LTSSM sequence, a single read of the FIFO status of the respective core is performed. Depending on the empty status and how many entries are in the FIFO, successive reads are executed.