Visible to Intel only — GUID: reh1567529829955
Ixiasoft
1. System Debugging Tools Overview
2. Design Debugging with the Signal Tap Logic Analyzer
3. Quick Design Verification with Signal Probe
4. In-System Debugging Using External Logic Analyzers
5. In-System Modification of Memory and Constants
6. Design Debugging Using In-System Sources and Probes
7. Analyzing and Debugging Designs with System Console
8. Intel® Quartus® Prime Pro Edition User Guide Debug Tools Archives
A. Intel® Quartus® Prime Pro Edition User Guides
1.1. System Debugging Tools Portfolio
1.2. Tools for Monitoring RTL Nodes
1.3. Stimulus-Capable Tools
1.4. Virtual JTAG Interface Intel® FPGA IP
1.5. System-Level Debug Fabric
1.6. SLD JTAG Bridge
1.7. Partial Reconfiguration Design Debugging
1.8. Preserving Signals for Debugging
1.9. System Debugging Tools Overview Revision History
2.1. Signal Tap Logic Analyzer Introduction
2.2. Signal Tap Debugging Flow
2.3. Step 1: Add the Signal Tap Logic Analyzer to the Project
2.4. Step 2: Configure the Signal Tap Logic Analyzer
2.5. Step 3: Compile the Design and Signal Tap Instances
2.6. Step 4: Program the Target Hardware
2.7. Step 5: Run the Signal Tap Logic Analyzer
2.8. Step 6: Analyze Signal Tap Captured Data
2.9. Other Signal Tap Debugging Flows
2.10. Signal Tap Logic Analyzer Design Examples
2.11. Custom State-Based Triggering Flow Examples
2.12. Signal Tap File Templates
2.13. Running the Stand-Alone Version of Signal Tap
2.14. Signal Tap Scripting Support
2.15. Signal Tap File Version Compatibility
2.16. Design Debugging with the Signal Tap Logic Analyzer Revision History
2.4.1. Preserving Signals for Monitoring and Debugging
2.4.2. Preventing Changes that Require Full Recompilation
2.4.3. Specifying the Clock, Sample Depth, and RAM Type
2.4.4. Specifying the Buffer Acquisition Mode
2.4.5. Adding Signals to the Signal Tap Logic Analyzer
2.4.6. Defining Trigger Conditions
2.4.7. Specifying Pipeline Settings
2.4.8. Filtering Relevant Samples
2.4.6.1. Basic Trigger Conditions
2.4.6.2. Nested Trigger Conditions
2.4.6.3. Comparison Trigger Conditions
2.4.6.4. Advanced Trigger Conditions
2.4.6.5. Custom Trigger HDL Object
2.4.6.6. Specify Trigger Position
2.4.6.7. Power-Up Triggers
2.4.6.8. External Triggers
2.4.6.9. Trigger Condition Flow Control
2.4.6.10. Sequential Triggering
2.4.6.11. State-Based Triggering
2.4.6.12. Trigger Lock Mode
2.4.6.11.5.1. <state_label>
2.4.6.11.5.2. <boolean_expression>
2.4.6.11.5.3. <action_list>
2.4.6.11.5.4. Trigger that Skips Clock Cycles after Hitting Condition
2.4.6.11.5.5. Storage Qualification with Post-Fill Count Value Less than m
2.4.6.11.5.6. Resource Manipulation Action
2.4.6.11.5.7. Buffer Control Actions
2.4.6.11.5.8. State Transition Action
2.8.1. Viewing Capture Data Using Segmented Buffers
2.8.2. Viewing Data with Different Acquisition Modes
2.8.3. Creating Mnemonics for Bit Patterns
2.8.4. Locating a Node in the Design
2.8.5. Saving Captured Signal Tap Data
2.8.6. Exporting Captured Signal Tap Data
2.8.7. Creating a Signal Tap List File
2.9.1. Signal Tap and Simulator Integration
2.9.2. Managing Multiple Signal Tap Configurations
2.9.3. Debugging Partial Reconfiguration Designs with Signal Tap
2.9.4. Debugging Block-Based Designs with Signal Tap
2.9.5. Debugging Devices that use Configuration Bitstream Security
2.9.6. Signal Tap Data Capture with the MATLAB* MEX Function
2.9.4.1.1. Partition Boundary Ports Method
2.9.4.1.2. Debug a Core Partition through Partition Boundary Ports
2.9.4.1.3. Export a Core Partition with Partition Boundary Ports
2.9.4.1.4. Signal Tap HDL Instance Method
2.9.4.1.5. Export a Core Partition with Signal Tap HDL Instances
2.9.4.1.6. Debug a Core Partition Exported with Signal Tap HDL Instances
3.1.1. Step 1: Reserve Signal Probe Pins
3.1.2. Step 2: Assign Nodes to Signal Probe Pins
3.1.3. Step 3: Connect the Signal Probe Pin to an Output Pin
3.1.4. Step 4: Compile the Design
3.1.5. (Optional) Step 5: Modify the Signal Probe Pins Assignments
3.1.6. Step 6: Run Fitter-Only Compilation
3.1.7. Step 7: Check Connection Table in Fitter Report
5.1. IP Cores Supporting ISMCE
5.2. Debug Flow with the In-System Memory Content Editor
5.3. Enabling Runtime Modification of Instances in the Design
5.4. Programming the Device with the In-System Memory Content Editor
5.5. Loading Memory Instances to the ISMCE
5.6. Monitoring Locations in Memory
5.7. Editing Memory Contents with the Hex Editor Pane
5.8. Importing and Exporting Memory Files
5.9. Access Two or More Devices
5.10. Scripting Support
5.11. In-System Modification of Memory and Constants Revision History
6.1. Hardware and Software Requirements
6.2. Design Flow Using the In-System Sources and Probes Editor
6.3. Compiling the Design
6.4. Running the In-System Sources and Probes Editor
6.5. Tcl interface for the In-System Sources and Probes Editor
6.6. Design Example: Dynamic PLL Reconfiguration
6.7. Design Debugging Using In-System Sources and Probes Revision History
7.1. Introduction to System Console
7.2. Starting System Console
7.3. System Console GUI
7.4. Launching a Toolkit in System Console
7.5. Using System Console Services
7.6. On-Board Intel® FPGA Download Cable II Support
7.7. MATLAB* and Simulink* in a System Verification Flow
7.8. System Console Examples and Tutorials
7.9. Running System Console in Command-Line Mode
7.10. Using System Console Commands
7.11. Using Toolkit Tcl Commands
7.12. Analyzing and Debugging Designs with the System Console Revision History
7.5.1. Locating Available Services
7.5.2. Opening and Closing Services
7.5.3. Using the SLD Service
7.5.4. Using the In-System Sources and Probes Service
7.5.5. Using the Monitor Service
7.5.6. Using the Device Service
7.5.7. Using the Design Service
7.5.8. Using the Bytestream Service
7.5.9. Using the JTAG Debug Service
Visible to Intel only — GUID: reh1567529829955
Ixiasoft
7.4.3. Filtering and Searching Interactive Instances
By default, the Toolkits list shows all toolkit instances and their respective channels linking to the System Console. This view is useful in simple cases, but can become very dense in a complex system having many debug-enabled IPs, and having potentially multiple FPGAs connected to System Console.
Figure 121. Toolkit Explorer with Filters
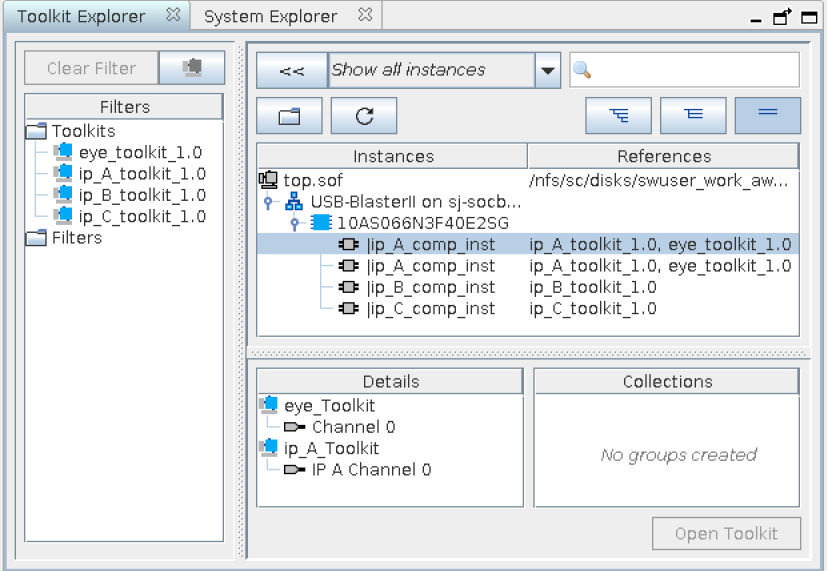
To limit the information display, the Filter list allows filtering the display by toolkit types currently available in the System Console. You can also create custom filters using groups, for example, “Inst A, Inst F, and Inst Z”, or “E-Tile and L/H-Tile Transceivers only".
To refine the list of toolkits, use the search field in the Toolkit Explorer to filter the list further.