Multi Channel DMA Intel® FPGA IP for PCI Express User Guide
ID
683821
Date
10/29/2021
Public
A newer version of this document is available. Customers should click here to go to the newest version.
1. Terms and Acronyms
2. Introduction
3. Functional Description
4. Interface Overview
5. Parameters (H-Tile)
6. Parameters (P-Tile and F-Tile)
7. Designing with the IP Core
8. Software Programming Model
9. Registers
10. Troubleshooting/Debugging
11. Multi Channel DMA Intel FPGA IP for PCI Express User Guide Archives
12. Revision History for Multi Channel DMA Intel FPGA IP for PCI Express User Guide
4.1. Port List
4.2. Clocks
4.3. Resets
4.4. Multi Channel DMA
4.5. Bursting Avalon-MM Master (BAM) Interface
4.6. Bursting Avalon-MM Slave (BAS) Interface
4.7. Config Slave Interface (RP only)
4.8. Hard IP Reconfiguration Interface
4.9. Config TL Interface
4.10. Configuration Intercept Interface (EP Only)
4.11. User Functional Level Reset (FLR)
4.12. User Event MSI-X Request Interface
8.1.6.1. ifc_api_start
8.1.6.2. ifc_mcdma_port_by_name
8.1.6.3. ifc_qdma_device_get
8.1.6.4. ifc_num_channels_get
8.1.6.5. ifc_qdma_channel_get
8.1.6.6. ifc_qdma_acquire_channels
8.1.6.7. ifc_qdma_release_all_channels
8.1.6.8. ifc_qdma_device_put
8.1.6.9. ifc_qdma_channel_put
8.1.6.10. ifc_qdma_completion_poll
8.1.6.11. ifc_qdma_request_start
8.1.6.12. ifc_qdma_request_prepare
8.1.6.13. ifc_qdma_descq_queue_batch_load
8.1.6.14. ifc_qdma_request_submit
8.1.6.15. ifc_qdma_pio_read32
8.1.6.16. ifc_qdma_pio_write32
8.1.6.17. ifc_qdma_pio_read64
8.1.6.18. ifc_qdma_pio_write64
8.1.6.19. ifc_qdma_pio_read128
8.1.6.20. ifc_qdma_pio_write128
8.1.6.21. ifc_qdma_pio_read256
8.1.6.22. ifc_qdma_pio_write256
8.1.6.23. ifc_request_malloc
8.1.6.24. ifc_request_free
8.1.6.25. ifc_app_stop
8.1.6.26. ifc_qdma_poll_init
8.1.6.27. ifc_qdma_poll_add
8.1.6.28. ifc_qdma_poll_wait
8.1.6.29. ifc_mcdma_port_by_name
10.1.4.4. Eye Viewer
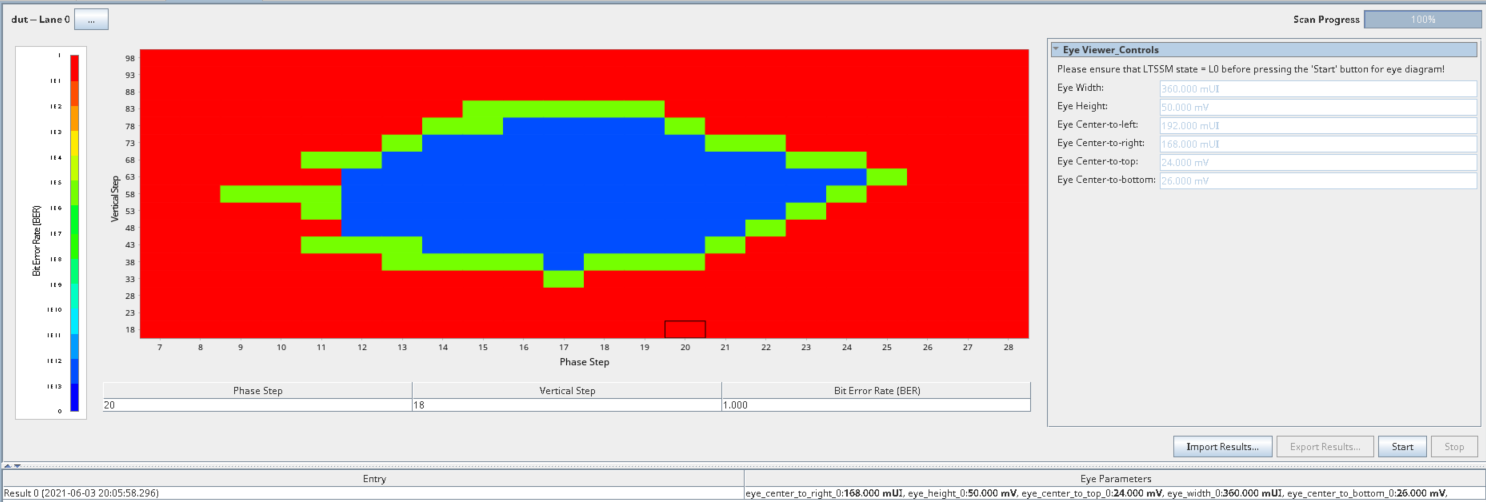
The P-Tile Debug Toolkit supports the Eye Viewer tool that allows you to plot the eye diagram for each channel. The Eye Viewer tool:
- Provides a pictorial representation of the eye for each channel, both in the bifurcated (e.g., x8x8) and non-bifurcated (e.g., x16) configurations.
- Provides information on the total eye height, total eye width and eye measurement information from the center of the eye to the four corners (left, right, top, bottom).
- Uses fixed step sizes in the horizontal and vertical directions.
- Performs the eye measurement at the following bit error rates (BER):
- 8.0 GT/s (Gen3) @ e-8, 100% confidence level
- 16.0 GT/s (Gen4) @ e-9, 90% confidence level
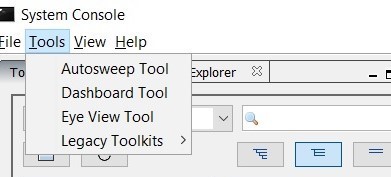
- In the System Console Tools menu option, click on Eye View Tool.
Figure 58. Opening the Eye Viewer
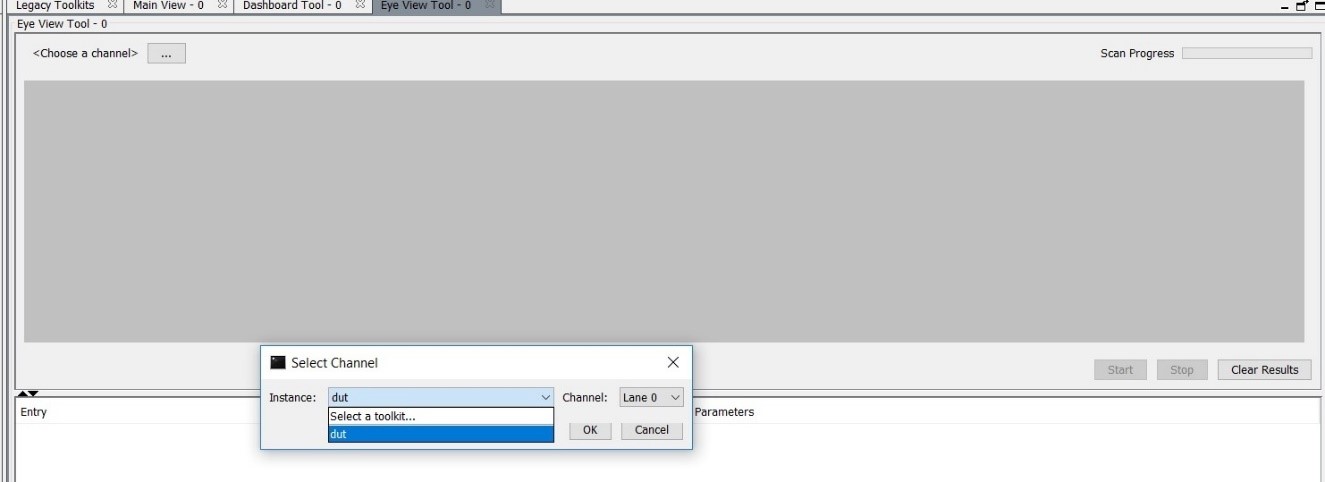
- This will open a new tab Eye View Tool next to the Main View tab. Choose the instance and channel for which you want to run the eye view tests.
Figure 59. Opening the Instance and Channel
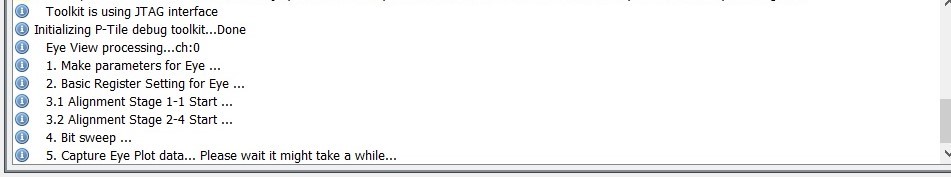
- The messages window displays information messages to indicate the eye view tool's progress.
Figure 60. Eye View Tool Messages
- Once the eye plot is complete, the eye height, eye width and eye diagram are displayed.
Figure 61. Sample Eye Plot