A newer version of this document is available. Customers should click here to go to the newest version.
Window: Summary - GPU Analysis
Use the Summary window as your starting point of the GPU Offload or GPU Compute/Media Hotspots performance analysis of the Intel® VTune™ Profiler. To access this window, click the Summary sub-tab in the result tab.
Use the Elapsed Time metric as your primary indicator and a baseline for comparison of results before and after optimization. Note that for multithreaded applications, the CPU Time is different from the Elapsed Time since the CPU Time is the sum of CPU time for all application threads.
Depending on the selected GPU analysis type, the following statistics is available in the Summary window:
GPU Utilization section helps identify whether the GPU was properly utilized.
EU Array Stalled/Idle section helps explore the most typical reasons of the EU waits for compute-bound applications.
FPU Utilization section helps identify kernels over-utilizing both FPUs for FPU-bound applications.
Bandwidth Utilization section provides statistics for memory-bound applications.
Click the  Copy to Clipboard button to copy the content of the selected summary section to the clipboard.
GPU Utilization
If your system satisfies configuration requirements for GPU analysis (i915 ftrace event collection is supported), VTune Profiler displays detailed GPU Utilization analysis data across all engines that had at least one DMA packet executed. By default, the VTune Profiler flags the GPU utilization less than 80% as a performance issue. In the example below, 85.9% of the application elapsed time was utilized by GPU engines.
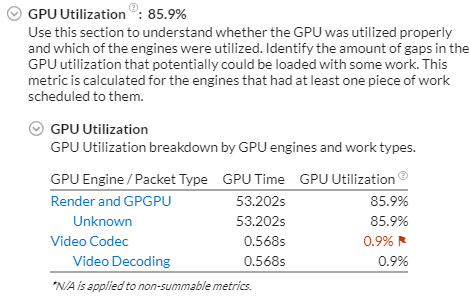
Depending on the target platform used for GPU analysis, the GPU Utilization section in the Summary window shows the time (in seconds) used by GPU engines. Note that GPU engines may work in parallel and the total time taken by GPU engines does not necessarily equal the application Elapsed time.
You may correlate GPU Time data with the Elapsed Time metric. The GPU Time value shows a share of the Elapsed time used by a particular GPU engine. If the GPU Time takes a significant portion of the Elapsed Time, it clearly indicates that the application is GPU-bound.
If your system does not support i915 ftrace event collection, all the GPU Utilization statistics will be calculated based on the hardware events and attributed to the Render and GPGPU engine.
The Summary view provides the Packet Queue Depth Histogram that helps you estimate the GPU software queue depth per GPU engine during the target run:
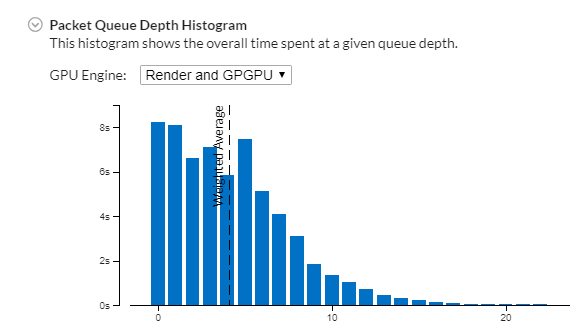
Ideally, your goal is an effective GPU engine utilization with evenly loaded queues and minimal duration for the zero queue depth.
For a high-level view of the DMA packet execution during the target run, review the Packet Duration Histogram:
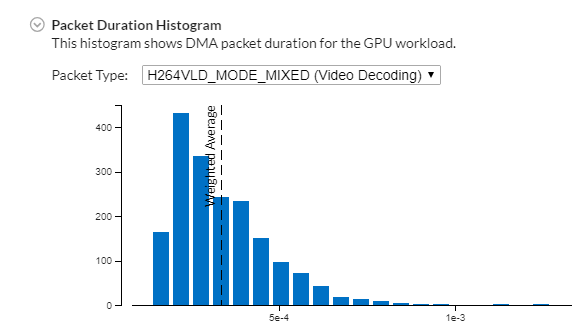
Select a required packet type from the drop-down menu and identify how effectively these packets were executed on the GPU. Having high Packet Count values for the minimal duration is optimal.
To get detailed information on the packet queues and execution, switch to the Platform tab and analyze the GPU software queue on the timeline.
For OpenCL™ applications, explore the Hottest GPU Computing Tasks section that helps you understand which OpenCL kernels had performance issues:
Mouse over a flagged computing task for details on a performance issue. For example, for the Intersect computing task a significant portion of the GPU time was spent in stalls, which may result from frequent sampler or memory accesses. Click a hot GPU computing task to open the Graphics window with this computing task pre-selected for your convenience.
EU Array Stalled/Idle
For the compute-bound workloads, explore the EU Array Stalled/Idle section that shows the most typical reasons why the execution units could be waiting. This section shows up for the analysis that collects Intel® HD Graphics and Intel® Iris® Graphics hardware events for the GPU Compute/Media Hotspots.
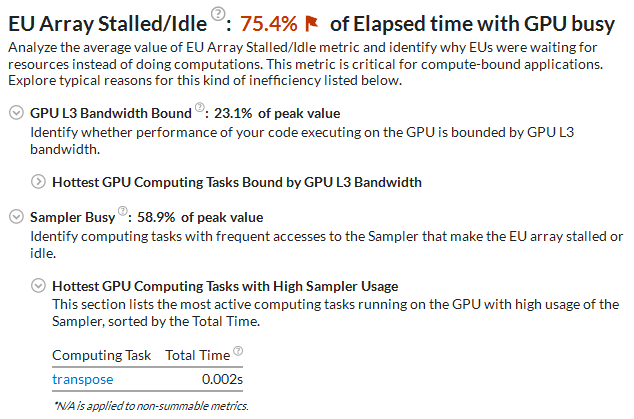
Depending on the event preset you used for the configuration, the VTune Profiler analyzes metrics for stalled/idle executions units. The GPU Compute/Media Hotspots analysis by default collects the Overview preset including the metrics that track general GPU memory accesses, such as Sampler Busy and Sampler Is Bottleneck, and GPU L3 bandwidth. As a result, the EU Array Stalled/Idle section displays the Sampler Busy section with a list of GPU computing tasks with frequent access to the Sampler and hottest GPU computing tasks bound by GPU L3 bandwidth:
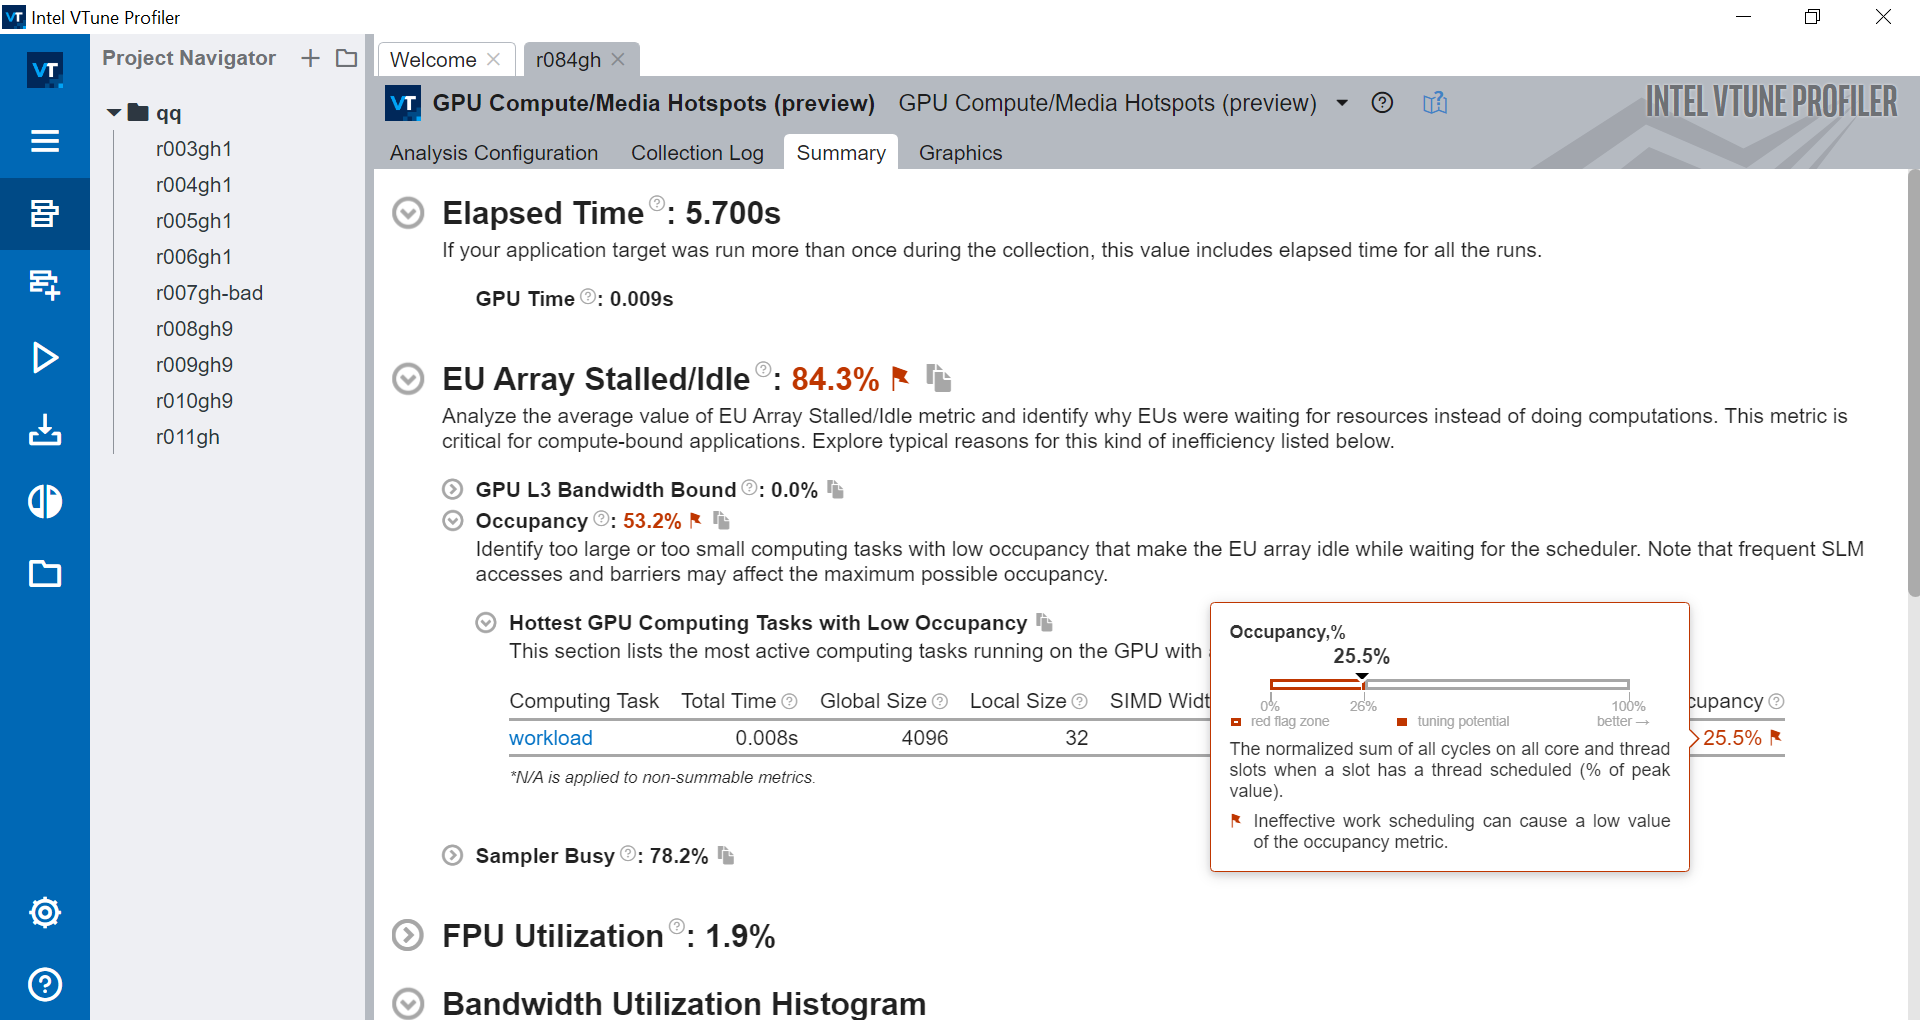
If you select the Compute Basic preset during the analysis configuration, VTune Profiler analyzes metrics that distinguish accessing different types of data on a GPU and displays the Occupancy section. See information about GPU tasks with low occupancy and understand how you can achieve peak occupancy:
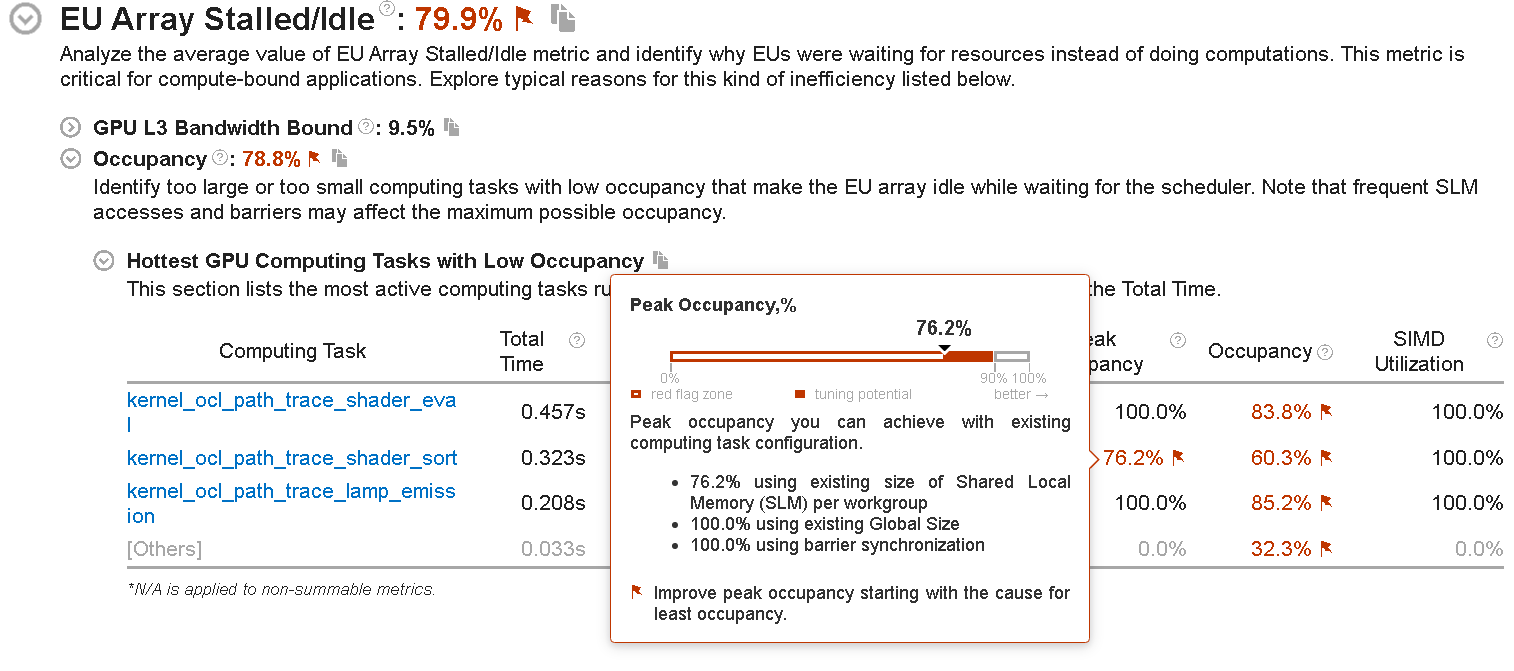
If the peak occupancy is flagged as a problem for your application, inspect factors that limit the use of all the threads on the GPU. Consider modifying your code with corresponding solutions:
| Factor responsible for Low Peak Occupancy | Solution |
|---|---|
SLM size requested per workgroup in a computing task is too high |
Decrease the SLM size or increase the Local size |
Global size (the number of working items to be processed by a computing task) is too low |
Increase Global size |
Barrier synchronization (the sync primitive can cause low occupancy due to a limited number of hardware barriers on a GPU subslice) |
Remove barrier synchronization or increase the Local size |
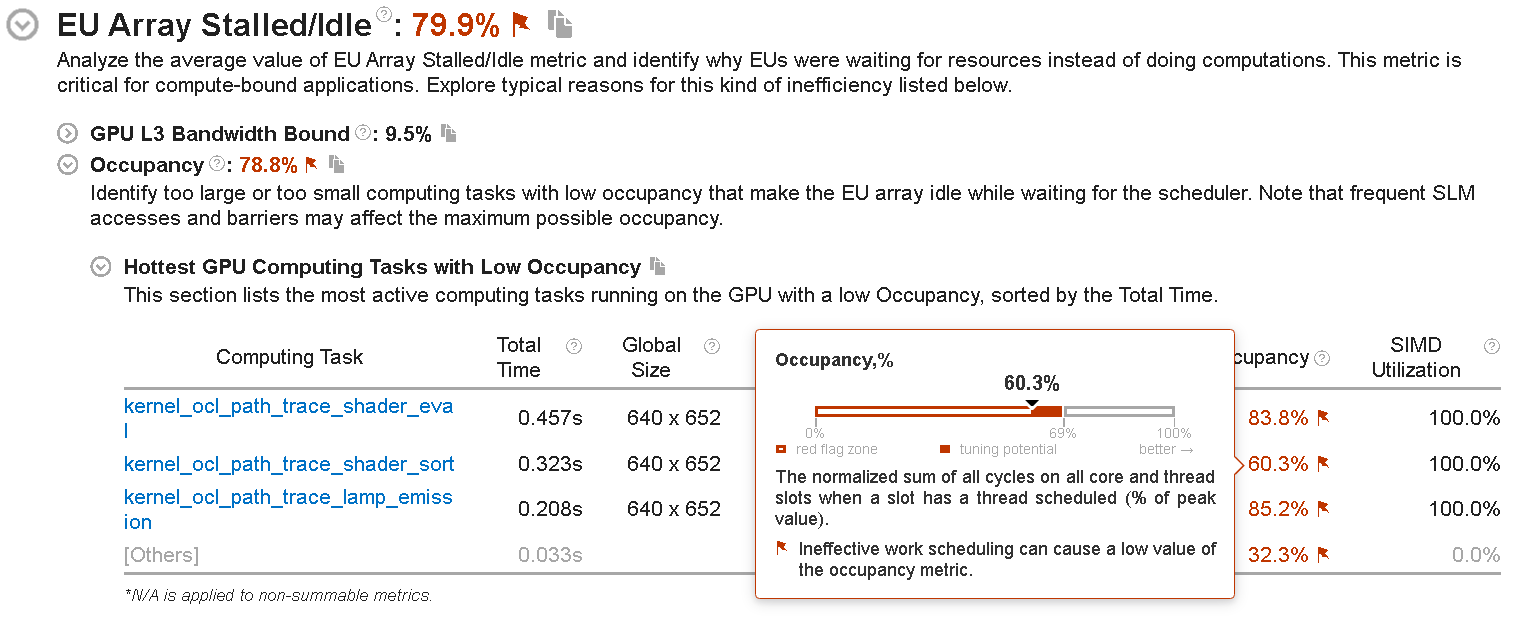
If the occupancy is flagged as a problem for your application, change your code to improve hardware thread scheduling. These are some reasons that may be responsible for ineffective thread scheduling:
- A tiny computing task could cause considerable overhead when compared to the task execution time.
- There may be high imbalance between the threads executing a computing task.
The Compute Basic preset also enables an analysis of the DRAM bandwidth usage. If the GPU workload is DRAM bandwidth-bound, the corresponding metric value is flagged. You can explore the table with GPU computing tasks heavily using the DRAM bandwidth during execution.
If you select the Full Compute preset and multiple run mode during the analysis configuration, the VTune Profiler will use both Overview and Compute Basic event groups for data collection and provide all types of reasons for the EU array stalled/idle issues in the same view.
To analyze Intel® HD Graphics and Intel® Iris® Graphics hardware events, make sure to set up your system for GPU analysis
FPU Utilization
If your application execution takes more than 80% of collection time heavily utilizing both floating point units (FPUs), the VTune Profiler highlights such a value as an issue and lists the kernels that overutilized the FPUs:
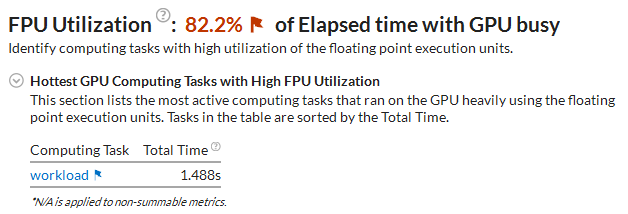
Click a flagged kernel to switch to the Graphics tab > Timeline pane, explore the distribution of the GPU EU Instructions metric that shows the FPU usage during the analysis run, and identify time ranges with the highest metric values. To address high FPU utilization issue for your code, consider reducing computations.
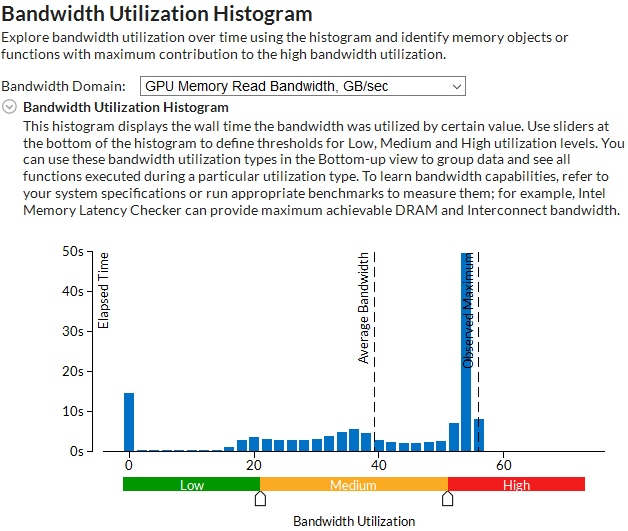
Bandwidth Utilization
For memory-bound applications, explore the Bandwidth Utilization Histogram section that includes statistics on the average system bandwidth and a Bandwidth Utilization histogram that shows how intensively your application was using each bandwidth domain:
Collection and Platform Info
Explore the platform information including GPU and CPU data. The last four GPU characteristics are specific to Intel® HD Graphics and Intel® Iris® Graphics.