A newer version of this document is available. Customers should click here to go to the newest version.
HPC Performance Characterization View
Use the HPC Performance Characterization viewpoint to estimate CPU usage, memory efficiency, and floating-point utilization for compute-intensive or throughput applications. Compute-intensive or throughput applications should use hardware resources efficiently for the duration of their elapsed time. Use the HPC Performance Characterization analysis as a starting point for optimizing application performance and runtime.
Follow these steps to interpret the performance data provided in the HPC Performance Characterization viewpoint:
Use the Analyzing an OpenMP* and MPI Application tutorial to review basic steps for tuning a hybrid application. The tutorial is available from the Intel Developer Zone at https://software.intel.com/en-us/itac-vtune-mpi-openmp-tutorial-lin. You can also find a webinar about HPC Performance Characterization analysis at https://software.intel.com/en-us/videos/hpc-applications-need-high-performance-analysis.
1. Define a Performance Baseline
Start with exploring the Summary window that provides general information on your application execution. Key areas for optimization include the elapsed time and floating-point operation per second counts (single precision, double precision, and legacy x87). Red text indicates an area of potential optimization. Hover over a flag to learn more about how to improve your code.
Use the Elapsed Time and GFLOPS values as a baseline for comparison of versions before and after optimization.

2. Determine Optimization Opportunities
Review the Summary window to find the key optimization opportunities for your application. Performance metrics that can be improved are marked in red. Issues identified could include Effective Physical Core Utilization, Memory Bound, Vectorization, or a combination of these. The following sections provide suggested next steps for each performance aspect:
- Topology, Memory, and Cross-Socket Bandwidth
- CPU Utilization
- GPU Utilization
- Memory Bound
- Vectorization
Topology, Memory, and Cross-Socket Bandwidth
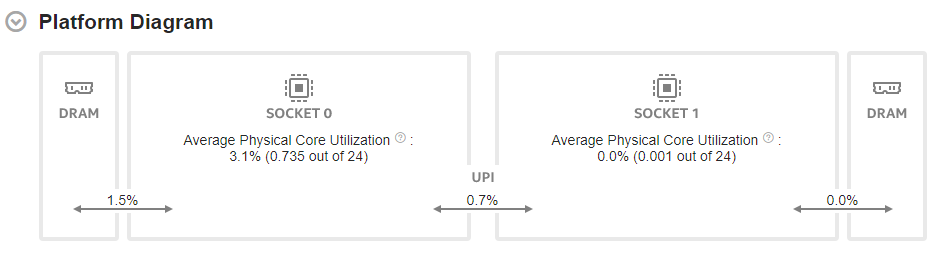
Start your performance analysis in the Summary window of the HPC Performance Characterization viewpoint. Here, the Platform Diagram displays system topology and utilization metrics for DRAM, Intel® Ultra Path Interconnect (Intel® UPI) links, and physical cores.
Sub-optimal application topology can result in induced DRAM and Intel® QuickPath Interconnect (Intel® QPI) or Intel® Ultra Path Interconnect (Intel® UPI) cross-socket traffic. These incidents can limit performance.
The platform diagram is available for:
- All client platforms.
- Server platforms based on Intel® microarchitecture code name Skylake, with up to four sockets.
If you selected the Evaluate max DRAM bandwidth option in your analysis configuration, the Platform Diagram shows the average DRAM utilization. Otherwise, the diagram shows the average DRAM bandwidth.
The Average UPI Utilization metric displays UPI utilization in terms of transmit. Irrespective of the number of UPI links that connect a pair of packages, the Platform Diagram shows a single cross-socket connection, . If there are several links, the diagram displays the maximum value.
On top of each socket, the Average Physical Core Utilization metric indicates the utilization of physical cores by computations of the application under analysis.
Once you examine the topology and utilization information in the diagram, focus on other sections in the Summary window and then switch to the Bottom-up window.
CPU Utilization
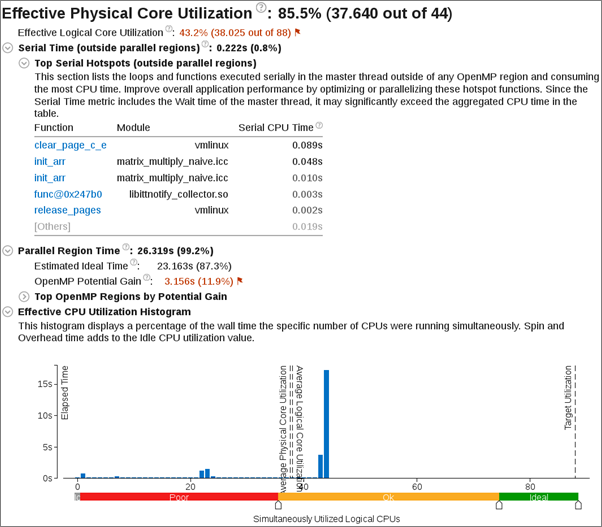
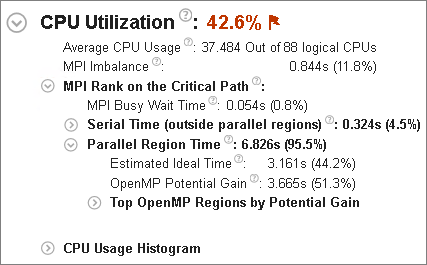
Explore the Effective Physical Core Utilization metric as a measure of the parallel efficiency of the application. A value of 100% means that the application code execution uses all available physical cores. If the value is less than 100%, it is worth looking at the second level metrics to discover reasons for parallel inefficiency.
Learn about opportunities to use the logical cores. In some cases, using logical cores leads to increases in application concurrency and overall performance improvements.
This table provides additional CPU utilization information for specific applications or hardware configurations.
| Application or Architecture Type | Notes and Recommendations |
|---|---|
Certain Intel® processors like Intel® Xeon Phi™ or Intel Atom®, or systems where Intel Hyper-Threading Technology (Intel HT Technology) is OFF or absent |
The metric breakdown between physical and logical core utilization is not available. In these cases, a single Effective CPU Utilization metric is displayed to show parallel execution efficiency. |
Applications that do not use OpenMP* or MPI runtime libraries |
|
Applications with Intel OpenMP* |
|
MPI applications |
Review the MPI Imbalance metric that shows the CPU time spent by ranks spinning in waits on communication operations, normalized by number of ranks on the profiling node. The metric issue detection description generation is based on minimal MPI Busy Wait time by ranks. If the minimal MPI Busy wait time by ranks is not significant, then the rank with the minimal time most likely lies on the critical path of application execution. In this case, review the CPU utilization metrics for this rank.
|
Hybrid MPI + OpenMP applications |
The sub-section MPI Rank on Critical Path shows OpenMP efficiency metrics like Serial Time (outside of any OpenMP region), Parallel Region time, and OpenMP Potential Gain. If the minimal MPI Busy Wait time is significant, it can be a result of suboptimal communication schema between ranks or imbalance triggered by another node. In this case, use Intel® Trace Analyzer and Collector for in depth analysis of communication schema. |
GPU Utilization
GPU utilization metrics display when:
Your application makes use of a GPU.
Your system is configured to collect GPU data. See Set Up System for GPU Analysis.
Under Elapsed Time, the GPU section presents an overview of how your application offloads work to the GPU.
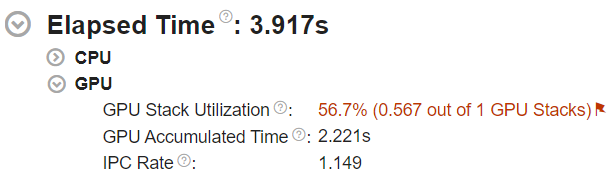
The GPU Stack Utilization metric indicates if the GPU was idle at any point during data collection. A value of 100% implies that your application offloaded work to the GPU throughout the duration of data collection. Anything lower presents an opportunity to improve GPU utilization. The representation of GPU utilization as the number of used GPU stacks provides context in terms of hardware.
The GPU Accumulated Time metric indicates the sum total of times spent by GPU stacks which had at least one execution thread scheduled. If there are multiple GPU stacks available in the system, the GPU Accumulated Time may be larger than the Elapsed Time .
The IPC Rate metric indicates the average number of instructions per cycle processed by the two FPU pipelines of Intel ®Integrated Graphics. To have your workload fully utilize the floating-point capability of the GPU, the IPC Rate should be closer to 2.
Next, look into the GPU Stack Utilization section. Here, you can understand if your workload can use the GPU more efficiently.
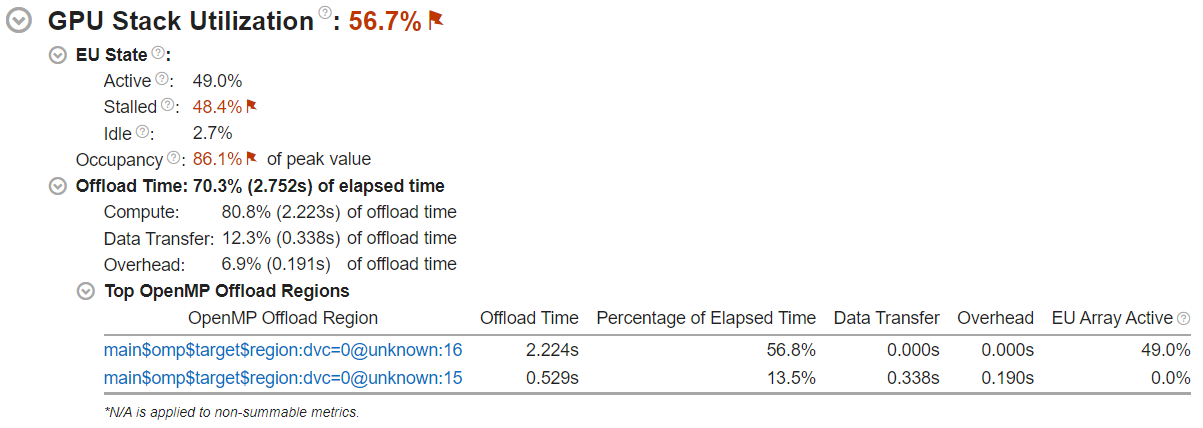
Ideally, your GPU stack utilization should be 100%. If the GPU Stack Utilization metric is <100%, there were cycles where the GPU had no execution threads scheduled.
EU State breaks down the activity of GPU execution units. Check here to see if they were stalled or idle when processing your workload.
Occupancy is a measure of the efficiency of scheduling the GPU thread. A value below 100% recommends that you tune the sizes of the work items in your workload. Consider running the GPU Offload Analysis. This provides an insight into computing tasks running on the GPU as well as additional GPU-related performance metrics.
If your application offloads code via Intel OpenMP*, check the Offload Time section:
The Offload Time metric displays the total duration of the OpenMP offload regions in your workload. If Offload Time is below 100%, consider offloading more code to the GPU.
The Compute, Data Transfer, and Overhead metrics help you understand what constitutes the Offload Time. Ideally, the Compute portion should be 100%. If the Data Transfer component is significant, try to transfer less data between the host and the GPU.
In the Top OpenMP Offload Regions section, review the breakdown of offload and GPU metrics by OpenMP offload region. Focus on regions that take up a significant portion of the Offload Time.
The names of the OpenMP offload regions use this format:
<func_name>$omp$target$region:dvc=<device_number>@<file_name>:<line_number>where:
- func_name is the name of the source function where the OpenMP target directive is declared.
- device_number is the internal OpenMP device number where the offload was targeted.
- file_name and line_number constitute the source location of the OpenMP target directive.
When you compile your OpenMP application, the func_name, file_name, and line_number fields require you to pass debug information options to the Intel Compiler. If debug information is absent, these fields get default values.
| Field | Compiler Options to Enable | Default Value | |
|---|---|---|---|
Linux OS |
Windows OS |
||
| line_number | -g |
/Zi |
0 |
| func_name | -g |
/Zi |
unknown |
| file_name | -g -mllvm -parallel-source-info=2 |
/Zi -mllvm -parallel-source-info=2 |
unknown |
For applications that use OpenMP offload, the Bottom-up window displays additional information.
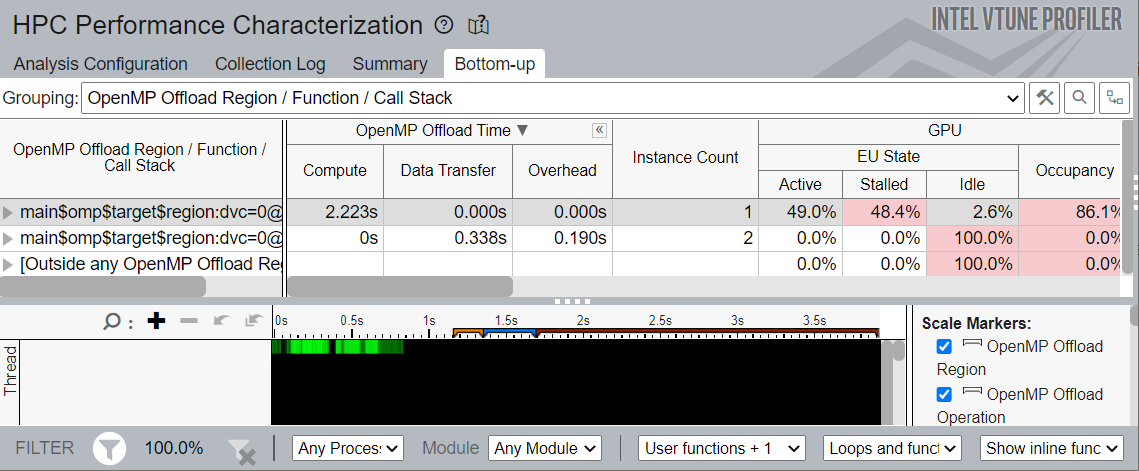
Group by OpenMP Offload Region. In this grouping, the grid displays:
- OpenMP Offload Time metrics
- Instance Count
- GPU metrics
The timeline view displays ruler markers that indicate the span of OpenMP Offload Regions and OpenMP Offload Operations within those regions.
Memory Bound
A high Memory Bound value might indicate that a significant portion of execution time was lost while fetching data. The section shows a fraction of cycles that were lost in stalls being served in different cache hierarchy levels (L1, L2, L3) or fetching data from DRAM. For last level cache misses that lead to DRAM, it is important to distinguish if the stalls were because of a memory bandwidth limit since they can require specific optimization techniques when compared to latency bound stalls. VTune Profiler shows a hint about identifying this issue in the DRAM Bound metric issue description. This section also offers the percentage of accesses to a remote socket compared to a local socket to see if memory stalls can be connected with NUMA issues.

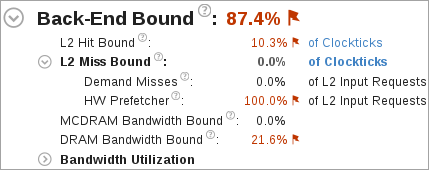
A high L2 Hit Bound or L2 Miss Bound value indicates that a high ratio of cycles were spent handing L2 hits or misses.
The L2 Miss Bound metric does not take into account data brought into the L2 cache by the hardware prefetcher. However, in some cases the hardware prefetcher can generate significant DRAM/MCDRAM traffic and saturate the bandwidth. The Demand Misses and HW Prefetcher metrics show the percentages of all L2 cache input requests that are caused by demand loads or the hardware prefetcher.
A high DRAM Bandwidth Bound or MCDRAM Bandwidth Bound value indicates that a large percentage of the overall elapsed time was spent with high bandwidth utilization. A high DRAM Bandwidth Bound value is an opportunity to run the Memory Access analysis to identify data structures that can be allocated in high bandwidth memory (MCDRAM), if it is available.
The Bandwidth Utilization Histogram shows how much time the system bandwidth was utilized by a certain value (Bandwidth Domain) and provides thresholds to categorize bandwidth utilization as High, Medium and Low. The thresholds are calculated based on benchmarks that calculate the maximum value. You can also set the threshold by moving sliders at the bottom of the histogram. The modified values are applied to all subsequent results in the project.
Switch to the Bottom-up window and review the Memory Bound columns in the grid to determine optimization opportunities.
If your application is memory bound, consider running a Memory Access analysis for deeper metrics and the ability to correlate these metrics with memory objects.
Vectorization
The Vectorization metric represents the percentage of packed (vectorized) floating point operations. 0% means that the code is fully scalar while 100% means the code is fully vectorized. The metric does not take into account the actual vector length used by the code for vector instructions. As a result, if the code is fully vectorized and uses a legacy instruction set that loaded only half a vector length, the Vectorization metric still shows 100%.
Low vectorization means that a significant fraction of floating point operations are not vectorized. Use Intel® Advisor to understand possible reasons why the code was not vectorized.
The second level metrics allow for rough estimates of the size of floating point work with particular precision and see the actual vector length of vector instructions with particular precision. Partial vector length can provide information about legacy instruction set usage and show an opportunity to recompile the code with modern instruction set, which can lead to additional performance improvement. Relevant metrics might include:
Instruction Mix
FP Arithmetic Instructions per Memory Read or Write
The Top Loops/Functions with FPU Usage by CPU Time table shows the top functions that contain floating point operations sorted by CPU time and allows for a quick estimate of the fraction of vectorized code, the vector instruction set used in the loop/function, and the loop type.

Intel® Omni-Path Fabric Usage
Intel® Omni-Path Fabric (Intel® OP Fabric) metrics are available for analysis of compute nodes equipped with Intel OP Fabric interconnect. They help to understand if MPI communication has bottlenecks connected with reaching interconnect hardware limits. The section shows two aspects interconnect usage: bandwidth and packet rate. Both bandwidth and packet rate split the data into outgoing and incoming data because the interconnect is bi-directional. A bottleneck can be connected with one of the directions.
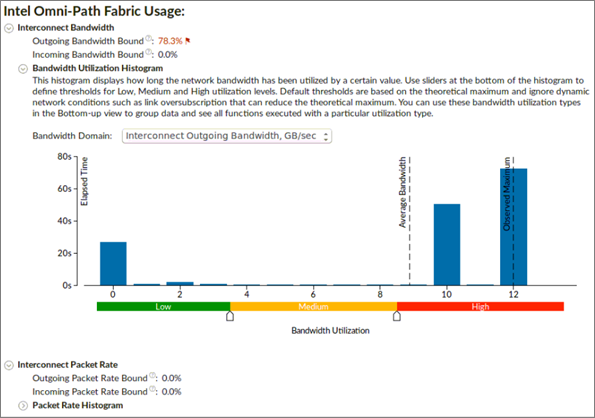
Outgoing and Incoming Bandwidth Bound metrics shows the percent of elapsed time that an application spent in communication closer to or reaching interconnect bandwidth limit.
Bandwidth Utilization Histogram shows how much time the interconnect bandwidth was utilized by a certain value (Bandwidth Domain) and provides thresholds to categorize bandwidth utilization as High, Medium, and Low.
Outgoing and Incoming Packet Rate metrics shows the percent of elapsed time that an application spent in communication closer to or reaching interconnect packet rate limit.
Packet Rate Histogram shows how much time the interconnect packet rate was reached by a certain value and provides thresholds to categorize packet rate as High, Medium, and Low.
3. Analyze Source
Double-click the function you want to optimize to view its related source code file in the Source/Assembly window. You can open the code editor directly from the Intel® VTune™ Profiler and edit your code (for example, minimizing the number of calls to the hotspot function).
4. Analyze Process/Thread Affinity
If the results show inefficient core utilization or NUMA effects, it can be helpful to know if and how threads are pinned to processor cores.
The thread pinning or affinity can be applied by parallel runtimes (such as MPI), by using environment variables, or by using APIs from parallel runtimes or the operating system. Use the knob Collect thread affinity in the VTune Profiler GUI or -knob collect-affinity=true in the command line to activate affinity collection for the HPC Performance Characterization analysis. With this option enabled it is possible to generate a thread affinity command line report that shows thread pinning to sockets, physical cores, and logical cores. Note that affinity information is collected at the end of the thread lifetime, so the resulting data may not show the whole issue for dynamic affinity that is changed during the thread lifetime.
A preview HTML report is available to see process/thread affinity along with thread CPU execution and remote accesses. Use the following command to generate the preview HTML report:
vtune -report affinity -format=html -r <result_dir>
This is a PREVIEW FEATURE. A preview feature may or may not appear in a future production release. It is available for your use in the hopes that you will provide feedback on its usefulness and help determine its future. Data collected with a preview feature is not guaranteed to be backward compatible with future releases.

5. Explore Other Analysis Types
Run a Memory Access analysis to view more detail about cache bound and memory bound issues affecting the performance of your application.
Use the Intel Advisor to analyze the application for vectorization optimization.