A newer version of this document is available. Customers should click here to go to the newest version.
Analyze SPDK Applications
Use the Input and Output analysis of Intel® VTune™ Profiler to profile SPDK applications and estimate SPDK Effective Time and SPDK Latency, and identify under-utilized throughput of an SPDK device.
To enable VTune Profiler capabilities, make sure SPDK is built using the --with-vtune=<vtune-install-dir> advanced build option.
When profiling in Attach to Process mode, make sure to set up the environment variables before launching the application.
Not available in Profile System mode.
SPDK Effective Time
Start your investigation with the Summary window that displays overall SPDK performance statistics, grouped by executed operation types.
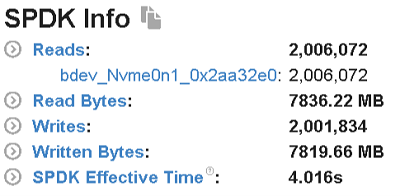
The SPDK Effective Time metric shows the amount of time the application spent performing any activity, excluding polling for I/O operation completion:

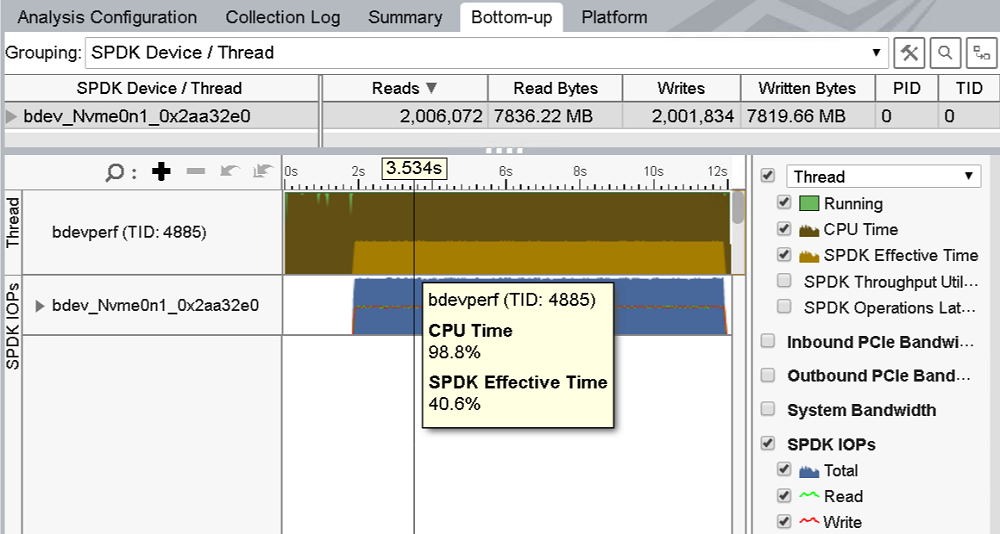
To analyze this metric on a per-thread basis, use the Bottom-up or Platform tabs:
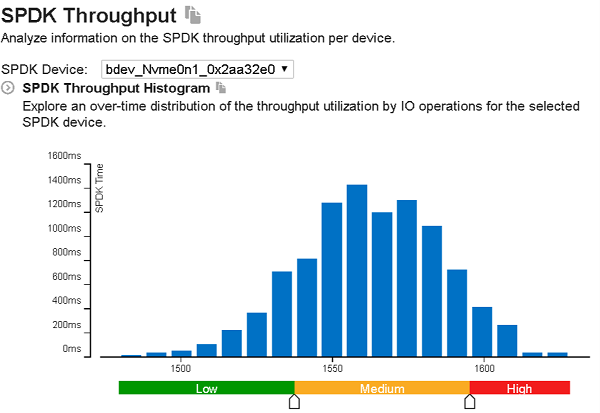
Analyze SPDK Throughput
Use the SPDK Throughput Utilization histogram of the Summary tab to understand utilization of specific storage devices managed by SPDK:
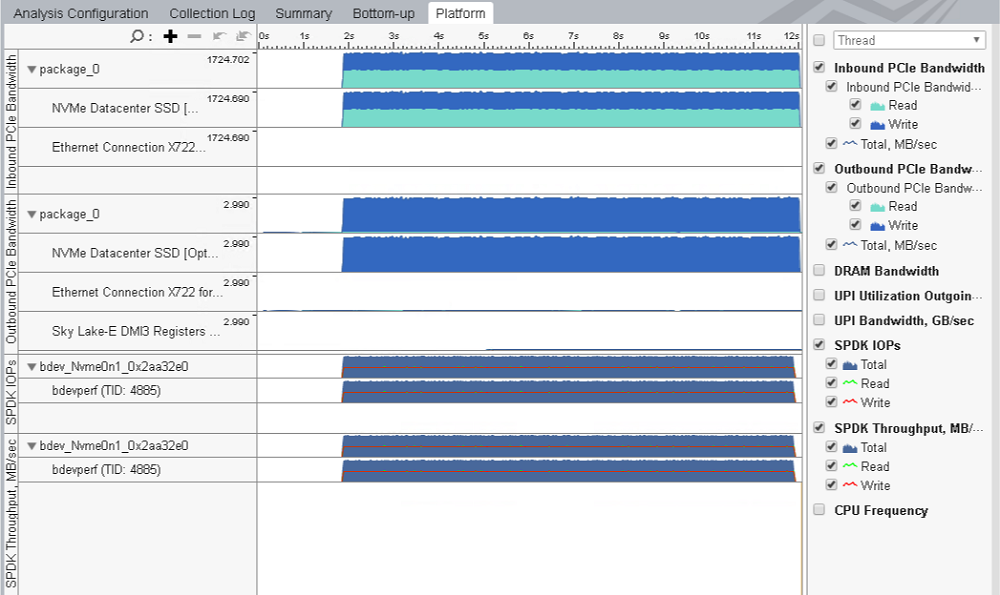
You can use the timeline in the Platform tab to correlate areas of SPDK throughput utilization with SPDK I/O operations and to get a breakdown of PCIe traffic per physical device:
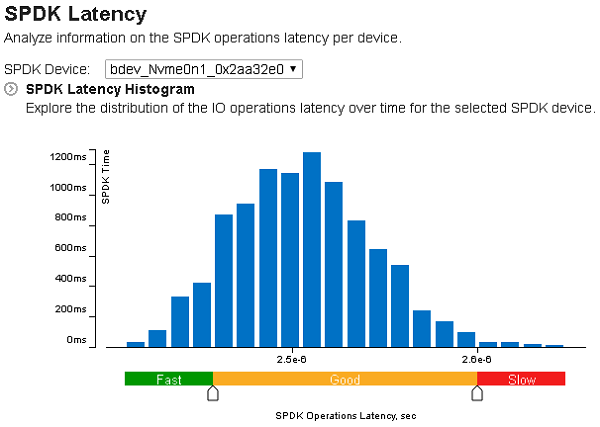
Analyze SPDK Latency
Explore the SPDK Latency histogram of the Summary tab to understand how much time the SPDK application spends experiencing certain I/O operation latency on a per-device basis.