A newer version of this document is available. Customers should click here to go to the newest version.
Microarchitecture Pipe
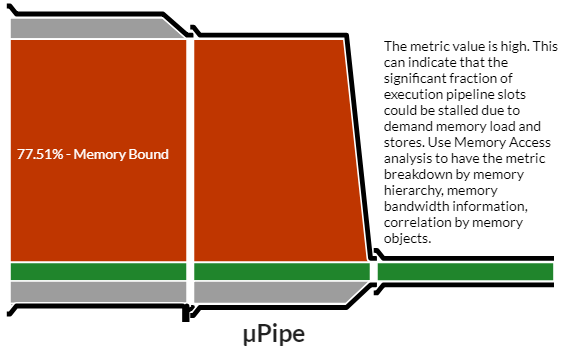
Explore the µPipe diagram of the CPU microarchitecture metrics provided by the Intel® VTune™ Profiler with the Microarchitecture Exploration analysis to identify inefficiencies in the CPU utilization.
When your Microarchitecture Exploration analysis result is collected, the VTune Profiler opens the Summary window that provides an overview of your target app performance based on the Top-down Microarchitecture Analysis Method (TMA). Treat the diagram as a pipe with an output flow equal to the ratio: Actual Instructions Retired/Possible Maximum Instruction Retired (pipe efficiency). If there are pipeline stalls decreasing retiring, the pipe shape gets narrow.

The µPipe is based on CPU pipeline slots that represent hardware resources needed to process one micro-operation. Usually there are several pipeline slots available (pipeline width). If pipeline slot does not retire, this is considered as a stall. The fraction of retired pipeline slots represents CPU Microarchitecture efficiency. If there were no stalls on all the CPU cycles, this is considered as 100% efficient CPU execution.
There are usually multiple reasons for stalling pipeline slots, identification of these reasons, as well as their root causes is a CPU Microarchitecture performance analysis process based on the TMA model.
The µPipe in the Microarchitecture Exploration viewpoint visualizes top-level CPU microarchitecture metrics as fractions of the overall number of pipeline slots in a pipe form where all the stalls are represented as obstacles making the pipe narrow.
The pipe is divided into 3 columns and 5 rows where each row represents a pipeline high-level metric:
- Retiring metric (a fraction of retired pipeline slots) in the middle green row represents the efficiency of the pipe and spans for all 3 columns.
- Memory Bound metric row above the Retiring metric spans for 2 columns.
- Core Bound metric row under the Retiring metric spans for 2 columns.
- Front-End Bound metric is the top row.
- Bad Speculation metric row at the bottom may have a dedicated representation of a drain meaning wasted CPU work.
The height of the whole pipe is a constant value. The height of every row equals the fraction represented by the corresponding metric.
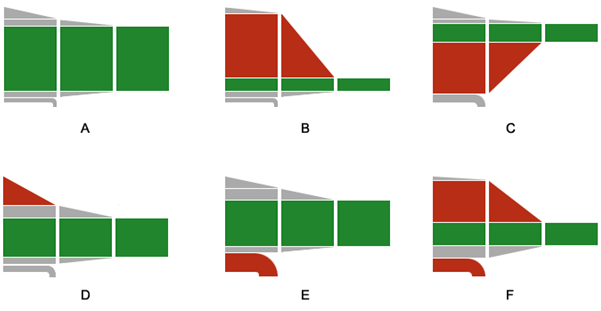
Red color signals a potential performance problem. A fraction of the green color in the diagram helps estimate how good execution efficiency is. So, the pipe form clearly represents existing CPU microarchitecture issues and enables you to recognize the following common patterns:

| A | no significant issues |
| B | Memory bound execution |
| C | Core bound execution |
| D | Front End bound execution |
| E | Bad Speculation issues (for example, branch misprediction) |
| F | a combination of Memory and Bad Speculation issues |
Example 1
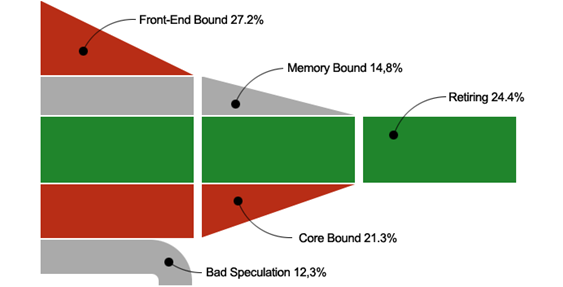
This an example of a pipe representing significant Front-End Bound and Core Bound issues limiting the whole efficiency to 24.4%:

Example 2
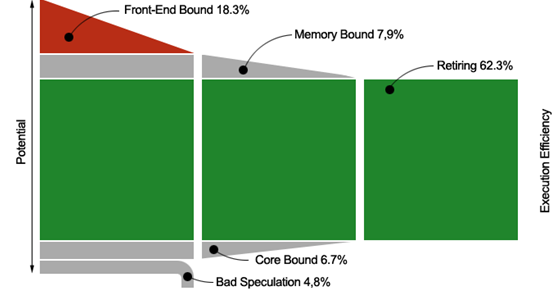
This is an example of good CPU execution efficiency with a Front-End issue:
