Overview
Use Intel VTune Profiler to analyze local and remote target systems from Windows* and Linux* hosts. Improve application and system performance through these operations:
- Analyze algorithm choices.
- Find serial and parallel code bottlenecks.
- Understand where and how your application can benefit from available hardware resources.
- Speed up the execution of your application.
Download Intel VTune Profiler
Download Intel VTune Profiler onto your system through one of these ways:
- Download the Standalone package.
- Get Intel VTune Profiler as part of the Intel® oneAPI Toolkit.
Understand the Workflow
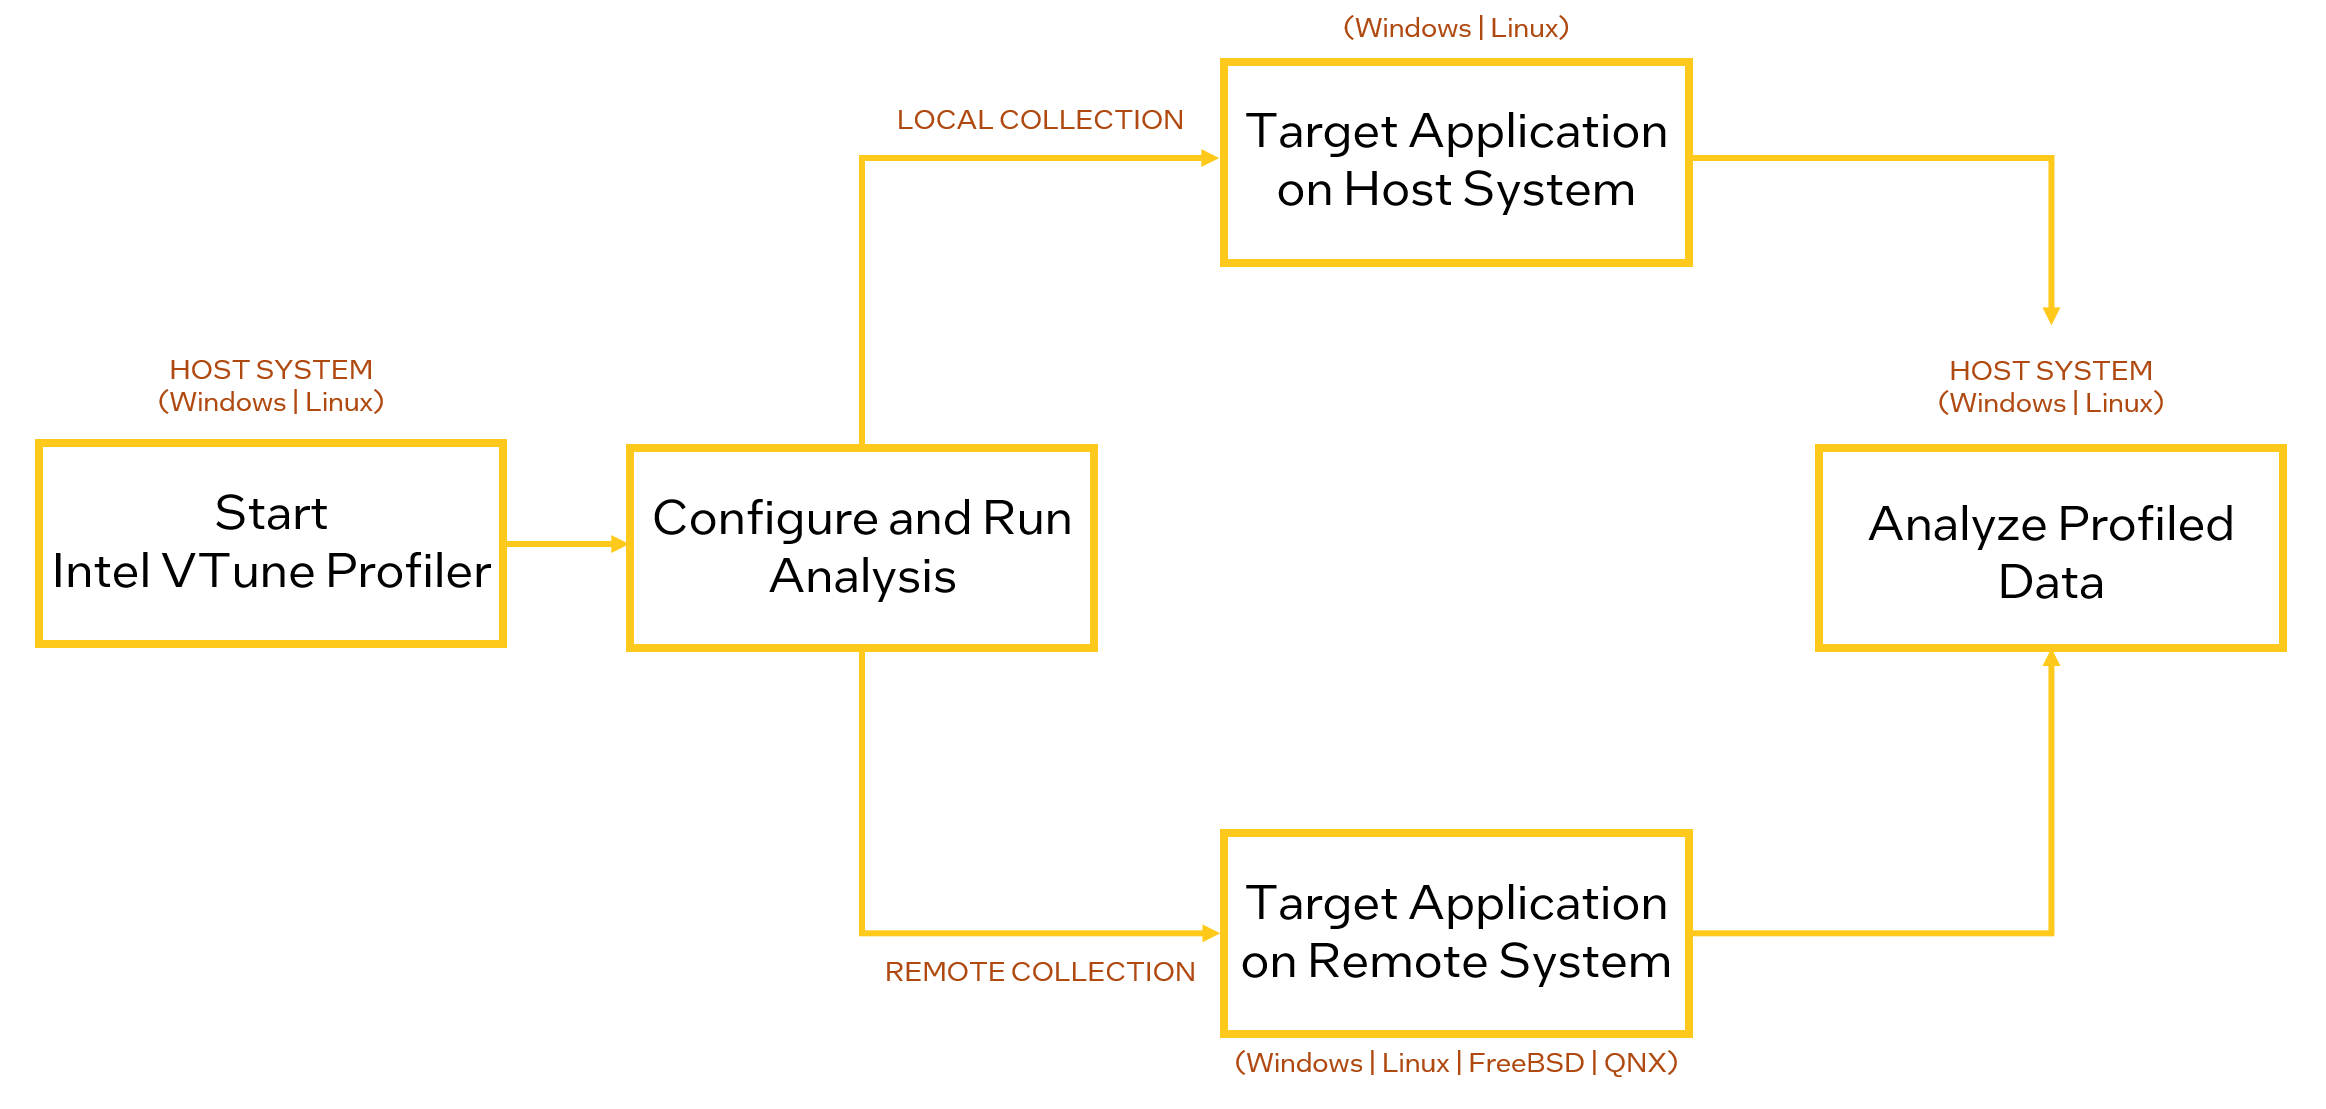
In the general workflow for software performance analysis,
- Start Intel VTune Profiler through one of these ways:
- Using the GUI
- From the Command Line
- Within Microsoft Visual Studio*
- Choose a profiling analysis for your application and configure settings.
- Profile the target application on the host (local collection) or target system (remote collection).
- View results on the host system.
- Find and fix bottlenecks over several cycles until you achieve satisfactory performance.