A newer version of this document is available. Customers should click here to go to the newest version.
Intel® Xeon Phi™ Processor Targets
The following figure shows basic workflow required to analyze an application running on Intel® Xeon Phi™ processors (code named Knights Landing and Knights Mill) based on Intel Many Integrated Core Architecture (Intel® MIC Architecture) or perform a system-wide analysis using Intel® VTune™ Profiler. Analysis is supported on a Linux* target with the self-boot version of the Intel Xeon Phi processor. You may choose to run one of the predefined analysis types, HPC Performance Characterization, Memory Access, Microarchitecture Exploration, Hotspots, or create a custom analysis type.
Instrumentation-based collections such as Hotspots in the user-mode sampling mode or Threading analysis can cause a significant overhead on the number of worker threads. Instead, use Hotspots analysis in the hardware event-based sampling mode or HPC Performance Characterization to explore application scalability.
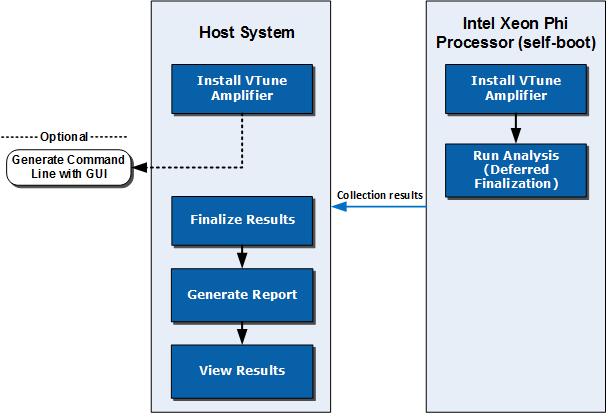
The workflow represented in the diagram is the recommended flow to speed up the analysis process. It is possible to run the full Intel VTune Profiler collection on the Intel Xeon Phi processor, but finalization and visualization might be slow. You can follow the regular analysis flow directly on the target Intel Xeon Phi processor.
Prerequisites
It is recommended to install the sampling driver for hardware event-based sampling collection types such as HPC Performance Characterization, Memory Access, Microarchitecture Exploration, or Hotspots (hardware event-based sampling mode). If the sampling driver is not installed, Intel VTune Profiler can work on Linux Perf*. Be aware of the following system configuration settings:
To enable system-wide and uncore event collection that allows the measurement of DRAM and MCDRAM memory bandwidth that is a part of the Memory Access and HPC Performance Characterization analysis types, use root or sudo to set /proc/sys/kernel/perf_event_paranoid to 0.
echo 0>/proc/sys/kernel/perf_event_paranoidTo enable collection with the Microarchitecture Exploration analysis type, increase the default limit of opened file descriptors. Use root or sudo to increase the default value in /etc/security/limits.conf to 100*<number_of_logical_CPU_cores>.
<user> hard nofile <100 * number_of_logic_CPU_cores>
<user> soft nofile <100 * number_of_logic_CPU_cores>
1. Configure and run analysis on the target system with an Intel Xeon Phi processor
There are two ways to configure and run the analysis on the target system:
Finalization on host system (recommended): Use a command to run the analysis on the system with the Intel Xeon Phi processor without finalizing. This option results in the best performance.
From a command prompt, run the collection with the deferred finalization option to calculate the binary check sum for proper symbol resolution on the host system. For example, to run a Memory Access analysis: vtune -collect memory-access -finalization-mode=deferred -r <my_result_dir> ./my_app
For more information, see vtune Command Syntax and finalization-mode topics.
TIP:You can also generate a command using the VTune Profiler GUI as described below. After generating the command, add the -finalization-mode=deferred option to the command to delay finalization.
Finalization on target system: Use the VTune Profiler GUI on the host system to generate a command for the target system with the Intel Xeon Phi processor. Run and finalize the analysis on the target system. This method may not provide the fastest results.
In the WHERE pane, select Arbitrary Host button, set the processor architecture to Intel® Processor code named Knights Landing, and specify the operating system type.
In the WHAT pane, select Launch Application and configure the analysis:
Enter the application name and parameters.
Select the Use MPI Launcher checkbox and provide the launcher name, number of ranks, ranks to profile, and result location.
In the HOW pane, select and configure an analysis type.
Click the Command Line button at the bottom of the window to generate the command.
Copy the generated command to a command prompt on the target system and run the analysis. Finalization begins after the analysis completes. Finalization may take several minutes.
2. Open the result on the host system
Copy the result to the host system (if the results collected on the target system are not available on the host via a share). Finalize the result if your command specified deferred finalization.
Copy the result to the host system using SSH or a similar method.
[Optional] Finalize the result by providing the result file and search directories to the binaries of interest if the module paths are different from the target system. For example: vtune -finalize -r <my_result_dir> -search-dir <my_binary_dir>
3. Open and interpret analysis results
There are two ways to view the results:
View results in the command line by running a command to generate a report based on the data collected. For example, the following command creates a hotspots report: vtune -report hotspots -r <my_result_dir>
Launch Intel VTune Profiler on the host system and view the result file.
Open Intel VTune Profiler.
Use the open result action on the toolbar or from the menu button to browse to the result file.
Analyze the results and make optimizations to your application.