Visible to Intel only — GUID: GUID-2BF32FA6-87F0-48C0-A991-FB93FCD86050
Prepare Application for Analysis
Windows* Targets
Linux* Targets
Embedded Linux* Targets
FreeBSD* Targets
QNX* Targets
Managed Code Targets
Android* Targets
Intel® Xeon Phi™ Processor Targets
Targets in Virtualized Environments
Targets in a Cloud Environment
Arbitrary Targets
Embedded System Targets
Build and Install the Sampling Drivers for Linux* Targets
Debug Information for Linux* Application Binaries
Compiler Switches for Performance Analysis on Linux* Targets
Enable Linux* Kernel Analysis
Resolution of Symbol Names for Linux-Loadable Kernel Modules
Analyze Statically Linked Binaries on Linux* Targets
Set Up Remote Linux* Target
User-Mode Sampling and Tracing Collection
Hardware Event-based Sampling Collection
Performance Snapshot
Algorithm Group
Microarchitecture Analysis Group
Parallelism Analysis Group
Input and Output Analysis
Accelerators Analysis Group
Platform Analysis Group
Hybrid CPU Analysis
Source Code Analysis
Custom Analysis
Energy Analysis
Code Profiling Scenarios
Control Data Collection
Manage Data Views
Manage Result Files
Java* Code Analysis
Configuring Java Data Collection
Identifying Hottest Methods
Analyzing Stacks for Mixed Code
Analyzing Hardware Metrics
Limitations
Python* Code Analysis
Intel® Threading Building Blocks Code Analysis
MPI Code Analysis
OpenSHMEM* Code Analysis with Fabric Profiler
GPU Application Analysis on Intel® HD Graphics and Intel® Iris® Graphics
Frame Data Analysis
Task Analysis
Switch Viewpoints
Control Window Synchronization
View Stacks
Manage Grid Views
Manage Timeline View
Change Threshold Values
Choose Data Format
Group and Filter Data
View Data on Inline Functions
Analyze Loops
Stitch Stacks for Intel® oneAPI Threading Building Blocks or OpenMP* Analysis
Search for Data
performance-snapshot Command Line Analysis
hotspots Command Line Analysis
anomaly-detection Command Line Analysis
threading Command Line Analysis
memory-consumption Command Line Analysis
hpc-performance Command Line Analysis
uarch-exploration Command Line Analysis
memory-access Command Line Analysis
tsx-exploration Command Line Analysis
tsx-hotspots Command Line Analysis
sgx-hotspots Command Line Analysis
gpu-hotspots Command Line Analysis
gpu-offload Command Line Analysis
graphics-rendering Command Line Analysis
fpga-interaction Command Line Analysis
io Command Line Analysis
system-overview Command Line Analysis
platform-profiler Command Line Analysis
runsa/runss Custom Command Line Analysis
Configure Analysis Options from Command Line
Collect System-Wide Data from Command Line
Collect Data on Remote Linux* Systems from Command Line
Configure GPU Analysis from Command Line
Specify Search Directories from Command Line
Specify Result Directory from Command Line
Pause Collection from Command Line
Manage Analysis Duration from Command Line
Limit Data Collection from Command Line
Option Descriptions and General Rules
allow-multiple-runs
analyze-kvm-guest
analyze-system
app-working-dir
call-stack-mode
collect
collect-with
column
command
cpu-mask
csv-delimiter
cumulative-threshold-percent
custom-collector
data-limit
discard-raw-data
duration
filter
finalization-mode
finalize
format
group-by
help
import
inline-mode
knob
kvm-guest-kallsyms
kvm-guest-modules
limit
loop-mode
mrte-mode
no-follow-child
no-summary
no-unplugged-mode
quiet
report
report-knob
report-output
report-width
result-dir
resume-after
return-app-exitcode
ring-buffer
search-dir
show-as
sort-asc
sort-desc
source-object
source-search-dir
stack-size
start-paused
strategy
target-install-dir
target-system
target-tmp-dir
target-duration-type
target-pid
target-process
time-filter
trace-mpi
user-data-dir
verbose
version
Best Practices: Resolve Intel® VTune™ Profiler BSODs, Crashes, and Hangs in Windows* OS
Error Message: Application Sets Its Own Handler for Signal
Error Message: Cannot Enable Event-Based Sampling Collection
Error Message: Cannot Collect GPU Hardware Metrics
Error Message: Cannot Collect GPU Hardware Metrics for the Selected GPU Adapter
Error Message: Cannot Load Data File
Error Message: Cannot Locate Debugging Information
Error Message: Cannot Open Data
Error Message: Client Is Not Authorized to Connect to Server
Error Message: Root Privileges Required for Processor Graphics Events
Error Message: No Pre-built Driver Exists for This System
Error Message: Not All OpenCL™ API Profiling Callbacks Are Received
Error Message: Problem Accessing the Sampling Driver
Error Message: Required Key Not Available
Error Message: Scope of ptrace System Call Is Limited
Error Message: Stack Size Is Too Small
Error Message: Symbol File Is Not Found
Problem: Analysis of the .NET* Application Fails
Problem: Cannot Access VTune Profiler Documentation
Problem: CPU time for Hotspots or Threading Analysis is Too Low
Problem: 'Events= Sample After Value (SAV) * Samples' Is Not True If Multiple Runs Are Disabled
Problem: Guessed Stack Frames
Problem: GUI Hangs or Crashes
Problem: Inaccurate Sum in the Grid
Problem: Information Collected via ITT API Is Not Available When Attaching to a Process
Problem: No GPU Utilization Data Is Collected
Problem: Same Functions Are Compared As Different Instances
Problem: Skipped Stack Frames
Problem: Stack in the Top-Down Tree Window Is Incorrect
Problem: Stacks in Call Stack and Bottom-Up Panes Are Different
Problem: System Functions Appear in the User Functions Only Mode
Problem: VTune Profiler is Slow to Respond When Collecting or Displaying Data
Problem: VTune Profiler is Slow on X-Servers with SSH Connection
Problem: Unexpected Paused Time
Problem: {Unknown Timer} in the Platform Power Analysis Viewpoint
Problem: Unknown Critical Error Due to Disabled Loopback Interface
Problem: Unknown Frames
Problem: Unreadable Text on macOS*
Problem: Unsupported Microsoft* Windows* OS
Warnings about Accurate CPU Time Collection
Context Menu: Grid
Context Menus: Call Stack Pane
Context Menus: Project Navigator
Context Menus: Source/Assembly Window
Dialog Box: Binary/Symbol Search
Dialog Box: Source Search
Hot Keys
Menu: Customize Grouping
Menu: Intel VTune Profiler
Pane: Call Stack
Pane: Options - General
Pane: Options - Result Location
Pane: Options - Source/Assembly
Project Navigator
Pane: Timeline
Toolbar: Configure Analysis
Toolbar: Filter
Toolbar: Source/Assembly
Toolbar: Intel VTune Profiler
Window: Bandwidth - Platform Power Analysis
Window: Bottom-up
Window: Caller/Callee
Window: Cannot Find <file type> File
Window: Collection Log
Window: Compare Results
Window: Configure Analysis
Window: Core Wake-ups - Platform Power Analysis
Window: Correlate Metrics - Platform Power Analysis
Window: CPU C/P States - Platform Power Analysis
Window: Debug
Window: Event Count - Hardware Events
Window: Flame Graph
Window: Graphics - GPU Compute/Media Hotspots
Window: Graphics C/P States - Platform Power Analysis
Window: NC Device States - Platform Power Analysis
Window: Platform
Window: Platform Power Analysis
Window: Sample Count - Hardware Events
Window: SC Device States - Platform Power Analysis
Window: Summary
Window: System Sleep States - Platform Power Analysis
Window: Temperature/Thermal Sample - Platform Power Analysis
Window: Timer Resolution - Platform Power Analysis
Window: Top-down Tree
Window: Uncore Event Count - Hardware Events
Window: Wakelocks - Platform Power Analysis
Window: Summary - Input and Output Summary
Window: Summary - Microarchitecture Exploration
Window: Summary - GPU Analysis
Window: Summary - Hardware Events
Window: Summary - Hotspots by CPU Utilization
Window: Summary - HPC Performance Characterization
Window: Summary - Memory Consumption
Window: Summary - Memory Usage
Window: Summary - Platform Power Analysis
Average Time
Computing Threads Started
Computing Threads Started, Threads/sec
CPU Time
EU 2 FPU Pipelines Active
EU Array Active
EU Array Idle
EU Array Stalled/Idle
EU Array Stalled
EU IPC Rate
EU Send pipeline active
EU Threads Occupancy
Global
GPU EU Array Usage
GPU L3 Bound
GPU L3 Miss Ratio
GPU L3 Misses
GPU L3 Misses, Misses/sec
GPU Memory Read Bandwidth, GB/sec
GPU Memory Texture Read Bandwidth, GB/sec
GPU Memory Write Bandwidth, GB/sec
GPU Texel Quads Count, Count/sec
GPU Utilization
Instance Count
L3 Sampler Bandwidth, GB/sec
L3 Shader Bandwidth, GB/sec
LLC Miss Rate due GPU Lookups
LLC Miss Ratio due GPU Lookups
Local
Maximum GPU Utilization
Occupancy
PS EU Active %
PS EU Stall %
Ratio to Max Bandwidth, %
Ratio to Max Bandwidth, %
Ratio to Max Bandwidth, %
Render/GPGPU Command Streamer Loaded
Samples Blended
Samples Killed in PS, pixels
Samples Written
Sampler Busy
Sampler Is Bottleneck
Shared Local Memory Read Bandwidth, GB/sec
Shared Local Memory Write Bandwidth, GB/sec
SIMD Width
Size
Total, GB/sec
Total Time
Typed Memory Read Bandwidth, GB/sec
Typed Memory Write Bandwidth, GB/sec
Typed Reads Coalescence
Typed Writes Coalescence
Untyped Memory Read Bandwidth, GB/sec
Untyped Memory Write Bandwidth, GB/sec
Untyped Reads Coalescence
Untyped Writes Coalescence
VS EU Active
VS EU Stall
Visible to Intel only — GUID: GUID-2BF32FA6-87F0-48C0-A991-FB93FCD86050
Java* Code Analysis
Use the Intel® VTune™ Profiler to analyze Java* applications executed with Oracle* or OpenJDK* (Linux* only).
Even though Java code execution is handled with a Managed Runtime Environment, it can be as ineffective in terms of data management as in programs written using native languages. For example, if you are conscious about performance of your data mining Java application, you need to take into consideration your target platform memory architecture, cache hierarchy and latency of access to memory levels. From the platform microarchitecture point of view, profiling of Java applications is similar to profiling of native applications but with one major difference: to see performance metrics against their program source code, the profiling tool must be able to map metrics of the binary code either compiled or interpreted by the JVM back to the original source code in Java or C/C++.
VTune Profiler provides a low-overhead analysis of the JIT compiled code that is available for both user-mode sampling and tracing and hardware event-based sampling analysis types. The analysis of the interpreted Java methods is limited.
To enable the Java code analysis with the Intel® VTune™ Profiler and interpret data:
Configuring Java Data Collection
To configure your performance analysis for Java code, you may use either GUI or command line (vtune) configuration. You may run Java code analysis using one of the following modes:
To configure Java analysis in the Launch Application mode:
Embed your java command in a batch file or executable script.
For example, create a run.bat file on Windows* or run.sh file on Linux* with the following command:
Windows:
> java.exe -Xcomp -Djava.library.path=native_lib\ia32 -cp C:\Design\Java\mixed_stacks MixedStacksTest 3 2Linux:
$ java -Xcomp -Djava.library.path=native_lib/ia32 -cp /home/Design/Java/mixed_stacks MixedStacksTest 3 2Create a project.
In the Configure Analysis window > WHERE pane, specify your analysis system, for example, Local Host.
In the WHAT pane, choose the Application to Launch target type.
In the Application field, specify a path to this run file . For example, on Linux:
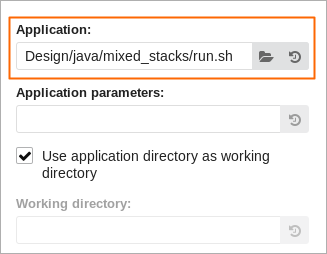
In the Advanced section, select the Auto Managed code profiling mode and enable the Analyze child processes option.
Similarly, you can configure an analysis with the VTune Profiler command line interface, vtune. For example, for the Hotspots analysis on Linux run the following command line:
$ vtune -collect hotspots -- run.shor directly:
$ vtune -collect hotspots -- java -Xcomp -Djava.library.path=native_lib/ia32 -cp home/Design/Java/mixed_stacks MixedStacksTest 3 2To configure Java analysis in the Attach to Process mode:
In case your Java application needs to run for some time or cannot be launched at the start of this analysis, you may attach the VTune Profiler to the standalone Java process. On Linux, you can also attach the VTune Profiler to a C/C++ application with an embedded JVM instance for hardware event-based sampling analysis types. To do this, select the Attach to Process target type in the WHAT pane and specify the java process name or PID.
You may use the command line interface to attach the analysis to the Java process. For example, the following command attaches the Hotspots analysis to the Java process:
$ vtune -collect hotspots -target-process javaThe following command line example attaches the Hotspots analysis to the Java process by its PID:
$ vtune -collect hotspots -target-pid 1234
NOTE:
The dynamic attach mechanism is supported only with the Java Development Kit (JDK).
To configure Java analysis in the Attach to Process mode under Low-privilege Account (Linux* Only):
For hardware event-based sampling analysis types, you can attach the VTune Profiler running under the superuser account to a Java process or a C/C++ application with embedded JVM instance running under a low-privileged user account. For example, you may attach the VTune Profiler to Java based daemons or services.
To do this, run the VTune Profiler under the root account, select the Attach to Process target type and specify the java process name or PID.
Identifying Hottest Methods
You may run the Hotspot analysis to get a list of the hottest methods along with their timing metrics and call stacks. The workload distribution over threads is also displayed in the Timeline pane. Thread naming helps to identify where exactly the most resource consuming code was executed. For example, on Linux*:
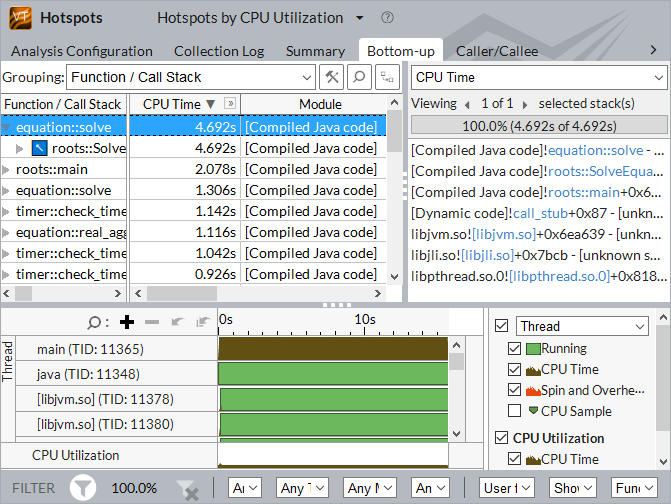
Analyzing Stacks for Mixed Code
If you are pursuing maximum performance on a platform, consider writing and compiling performance critical modules of your Java project in native languages like C or even assembly. This way of programming helps to employ powerful CPU resources like vector computing (implemented via SIMD units and instruction sets). In this case, compute-intensive functions become hotspots in the profiling results, which is expected as they do most of the job. However, you might be interested not only in hotspot functions, but in identifying locations in Java code these functions were called from via a JNI interface. Tracing such cross-runtime calls in the mixed language algorithm implementations could be a challenge.
To analyze mixed code profiling results, the VTune Profiler is "stitching" the Java call stack with the subsequent native call stack of C/C++ functions. The reverse call stacks stitching works as well. For example, on Windows*:

|
Native function |
|
Mixed native/Java call stack |
|
Native module |
|
Compiled methods in the Java call stack |


NOTE:
Due to inlining during the compilation stage, some functions may not appear in the stack by default. Make sure to select the Show inline functions option for the Inline Mode on the filter bar.
Analyzing Hardware Metrics
VTune Profiler also provides an advanced profiling option of optimizing Java applications for the CPU microarchitecture utilized in your platform. Although Java and JVM technology is intended to free a developer from hardware architecture specific coding, once Java code is optimized for the current Intel microarchitecture, it will most probably keep this advantage for future generations of CPUs. You may use the hardware event-based sampling data collection that monitors hardware events in the CPU's pipeline and can identify coding pitfalls limiting the most effective execution of instructions in the CPU. The CPU metrics are available and can be displayed against the application modules, functions, and Java code source lines. You may also run the hardware event-based sampling collection with stacks when you need to find out a call path for a function called in a driver or middleware layer in your system.
Limitations
VTune Profiler supports analysis of Java applications with some limitations:
System-wide profiling is not supported for managed code.
The JVM interprets some rarely called methods instead of compiling them for the sake of performance. VTune Profiler does not recognize interpreted Java methods and marks such calls as !Interpreter in the restored call stack.
If you want such functions to be displayed in stacks with their names, force the JVM to compile them by using the -Xcomp option (show up as [Compiled Java code] methods in the results). However, the timing characteristics may change noticeably if many small or rarely used functions are being called during execution.
When opening source code for a hotspot, the VTune Profiler may attribute events or time statistics to an incorrect piece of the code. It happens due to JDK Java VM specifics. For a loop, the performance metric may slip upward. Often the information is attributed to the first line of the hot method's source code. In the example below, a real hotspot line consuming most CPU time is line 35.

Consider events and time mapping to the source code lines as approximate.
For the Hotspots analysis type in the user-mode sampling mode, the VTune Profiler may display only a part of the call stack. To view the complete stack on Windows, use the -Xcomp additional command line JDK Java VM option that enables the JIT compilation for better quality of stack walking.
To view the complete stack on Linux, use additional command line JDK Java VM options that change behavior of the Java VM:
Use the -Xcomp additional command line JDK Java VM option that enables the JIT compilation for better quality of stack walking.
On Linux* x86, use client JDK Java VM instead of the server Java VM: either explicitly specify -client, or simply do not specify -server JDK Java VM command line option.
On Linux x64, specify -XX:-UseLoopCounter command line option that switches off on-the-fly substitution of the interpreted method with the compiled version.
Java application profiling is supported for the Hotspots and Microarchitecture analysis types. Support for the Threading analysis is limited as some embedded Java synchronization primitives (which do not call operating system synchronization objects) cannot be recognized by the VTune Profiler. As a result, some of the timing metrics may be distorted.
There are no dedicated libraries supplying a user API for collection control in the Java source code. However, you may want to try applying the native API by wrapping the __itt calls with JNI calls.
Parent topic: Code Profiling Scenarios