A newer version of this document is available. Customers should click here to go to the newest version.
GPU Rendering Analysis (Preview)
Use the GPU Rendering analysis to estimate your code performance based on the GPU usage per engine and GPU hardware metrics.
This is a PREVIEW FEATURE. A preview feature may or may not appear in a future production release. It is available for your use in the hopes that you will provide feedback on its usefulness and help determine its future. Data collected with a preview feature is not guaranteed to be backward compatible with future releases.
How It Works
GPU Rendering analysis focuses on the following usage models:
System-wide profiling on all virtual domains (Dom0, DomUs) running under the Xen* hypervisor to identify domains that take too many resources and introduce a bottleneck for the whole platform:
Profiling of OpenGL-ES applications running on Linux* systems to detect performance-critical API calls:
Prerequisites
For successful analysis, make sure to configure your system as follows:
For Xen virtualization platforms:
Virtualize CPU performance counters on a Xen platform to enable full-scale event-based sampling.
Establish a password-less SSH connection to the remote target system with the Xen platform installed.
To analyze Intel® HD and Intel® Iris® Graphics hardware events on a GPU, make sure to set up your system for GPU analysis
Select Target
Your project configuration for the GPU Rendering analysis depends on the analysis target to profile:
For Xen platform-wide analysis on all virtual domains (Dom0, DomUs), select the Profile System target type.
For a graphical app using OpenGL-ES API, select the Launch Application or Attach to Process target types.
These two usage models are mutually exclusive. This means that the Xen platform-wide analysis does not detect OpenGL-ES API calls, and, respectively, Xen virtual domain statistics is not available in the Launch Application and Attach to Process mode.
Configure and Run Analysis
To configure and run the GPU Rendering analysis:
Click the
 (standalone GUI)/
 (Visual Studio IDE) Configure Analysis button on the Intel® VTune™ Profiler toolbar.
 The Configure Analysis window opens.
From HOW pane, click the
 Browse button and select GPU Rendering.
 Optionally, you may edit the following collection options:
Use the GPU sampling internal, ms field to specify an interval (in milliseconds) between GPU samples for GPU hardware metrics collection. By default, the VTune Profiler uses 1ms interval for the hardware event-based sampling collection and 1000ms for the user-mode sampling and tracing collection.
Use the Analyze Processor Graphics hardware events option to monitor the Render and GPGPU engine usage (Intel Graphics only), identify which parts of the engine are loaded, and correlate GPU and CPU data. This option requires root/administrative privileges.
VTune Profiler provides platform-specific presets of the hardware metrics. For this analysis, the Render Basic event group is pre-selected. All presets collect data about execution units (EUs) activity: EU Array Active, EU Array Stalled, EU Array Idle, Computing Threads Started, and Core Frequency.
Overview event set also includes metrics that track general GPU memory accesses such as Memory Read/Write Bandwidth, GPU L3 Misses, Sampler Busy, Sampler Is Bottleneck, and GPU Memory Texture Read Bandwidth. These metrics can be useful for both graphics and compute-intensive applications.
Compute Basic (with global/local memory accesses) event group also includes metrics that distinguish accessing different types of data on a GPU: Untyped Memory Read/Write Bandwidth, Typed Memory Read/Write Transactions, SLM Read/Write Bandwidth, Render/GPGPU Command Streamer Loaded, and GPU EU Array Usage. These metrics are useful for compute-intensive workloads on the GPU.
Compute Extended event group includes metrics targeted only for GPU analysis on the Intel processor code name Broadwell and higher. For other systems, this preset is not available.
Render Basic (preview) event group includes Pixel Shader, Vertex Shader, and Output Merger metrics
- Full Compute event group is a combination of the Overview and Compute Basic event sets.
To modify a pre-defined option in the Details section or change the list of collected hardware events, create a new custom analysis type.
Click the
 Start button to run the analysis.
To run the analysis from the command line, use the  Command Line button at the bottom.
VTune Profiler collects data on the specified target and opens the result in the GPU Rendering viewpoint.
View Data
Start you analysis with the Summary view to understand whether your workload is CPU or GPU bound. Then, move to the Platform view that helps you visualize how GPU tasks are scheduled by CPU threads, identify CPU threads or processes utilizing graphics and understand what the CPU is doing while the GPU is executing.
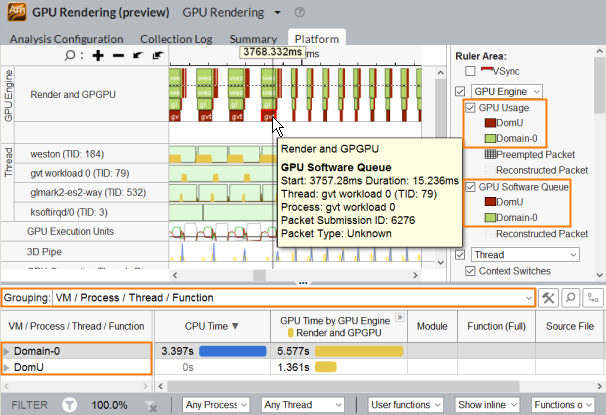
For Xen platform-wide analysis, use the Platform view to identify virtual domains actively utilizing the GPU on the embedded system. GPU activities are colored on the timeline to mark a proper virtual domain.
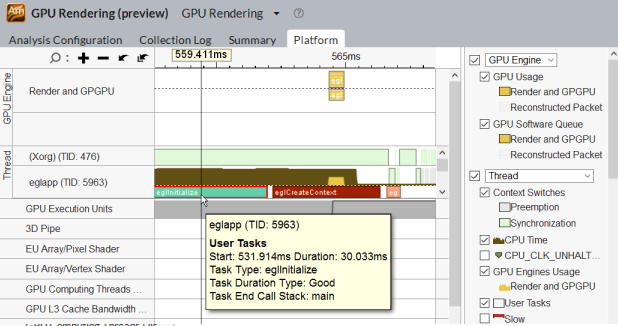
If you analyze an application with OpenGL-ES API calls, the Platform view will show the calls as user tasks with detailed information available in the tooltip.