Visible to Intel only — GUID: GUID-387FDAB0-B102-47BB-BE7D-D87B5109C2E3
Prepare Application for Analysis
Windows* Targets
Linux* Targets
Embedded Linux* Targets
FreeBSD* Targets
QNX* Targets
Managed Code Targets
Android* Targets
Intel® Xeon Phi™ Processor Targets
Targets in Virtualized Environments
Targets in a Cloud Environment
Arbitrary Targets
Embedded System Targets
Build and Install the Sampling Drivers for Linux* Targets
Debug Information for Linux* Application Binaries
Compiler Switches for Performance Analysis on Linux* Targets
Enable Linux* Kernel Analysis
Resolution of Symbol Names for Linux-Loadable Kernel Modules
Analyze Statically Linked Binaries on Linux* Targets
Set Up Remote Linux* Target
User-Mode Sampling and Tracing Collection
Hardware Event-based Sampling Collection
Performance Snapshot
Algorithm Group
Microarchitecture Analysis Group
Parallelism Analysis Group
Input and Output Analysis
Accelerators Analysis Group
Platform Analysis Group
Hybrid CPU Analysis
Source Code Analysis
Custom Analysis
Energy Analysis
Code Profiling Scenarios
Control Data Collection
Manage Data Views
Manage Result Files
Switch Viewpoints
Control Window Synchronization
View Stacks
Manage Grid Views
Manage Timeline View
Change Threshold Values
Choose Data Format
Group and Filter Data
View Data on Inline Functions
Analyze Loops
Stitch Stacks for Intel® oneAPI Threading Building Blocks or OpenMP* Analysis
Search for Data
performance-snapshot Command Line Analysis
hotspots Command Line Analysis
anomaly-detection Command Line Analysis
threading Command Line Analysis
memory-consumption Command Line Analysis
hpc-performance Command Line Analysis
uarch-exploration Command Line Analysis
memory-access Command Line Analysis
tsx-exploration Command Line Analysis
tsx-hotspots Command Line Analysis
sgx-hotspots Command Line Analysis
gpu-hotspots Command Line Analysis
gpu-offload Command Line Analysis
graphics-rendering Command Line Analysis
fpga-interaction Command Line Analysis
io Command Line Analysis
system-overview Command Line Analysis
platform-profiler Command Line Analysis
runsa/runss Custom Command Line Analysis
Configure Analysis Options from Command Line
Collect System-Wide Data from Command Line
Collect Data on Remote Linux* Systems from Command Line
Configure GPU Analysis from Command Line
Specify Search Directories from Command Line
Specify Result Directory from Command Line
Pause Collection from Command Line
Manage Analysis Duration from Command Line
Limit Data Collection from Command Line
Option Descriptions and General Rules
allow-multiple-runs
analyze-kvm-guest
analyze-system
app-working-dir
call-stack-mode
collect
collect-with
column
command
cpu-mask
csv-delimiter
cumulative-threshold-percent
custom-collector
data-limit
discard-raw-data
duration
filter
finalization-mode
finalize
format
group-by
help
import
inline-mode
knob
kvm-guest-kallsyms
kvm-guest-modules
limit
loop-mode
mrte-mode
no-follow-child
no-summary
no-unplugged-mode
quiet
report
report-knob
report-output
report-width
result-dir
resume-after
return-app-exitcode
ring-buffer
search-dir
show-as
sort-asc
sort-desc
source-object
source-search-dir
stack-size
start-paused
strategy
target-install-dir
target-system
target-tmp-dir
target-duration-type
target-pid
target-process
time-filter
trace-mpi
user-data-dir
verbose
version
Best Practices: Resolve Intel® VTune™ Profiler BSODs, Crashes, and Hangs in Windows* OS
Error Message: Application Sets Its Own Handler for Signal
Error Message: Cannot Enable Event-Based Sampling Collection
Error Message: Cannot Collect GPU Hardware Metrics
Error Message: Cannot Collect GPU Hardware Metrics for the Selected GPU Adapter
Error Message: Cannot Load Data File
Error Message: Cannot Locate Debugging Information
Error Message: Cannot Open Data
Error Message: Client Is Not Authorized to Connect to Server
Error Message: Root Privileges Required for Processor Graphics Events
Error Message: No Pre-built Driver Exists for This System
Error Message: Not All OpenCL™ API Profiling Callbacks Are Received
Error Message: Problem Accessing the Sampling Driver
Error Message: Required Key Not Available
Error Message: Scope of ptrace System Call Is Limited
Error Message: Stack Size Is Too Small
Error Message: Symbol File Is Not Found
Problem: Analysis of the .NET* Application Fails
Problem: Cannot Access VTune Profiler Documentation
Problem: CPU time for Hotspots or Threading Analysis is Too Low
Problem: 'Events= Sample After Value (SAV) * Samples' Is Not True If Multiple Runs Are Disabled
Problem: Guessed Stack Frames
Problem: GUI Hangs or Crashes
Problem: Inaccurate Sum in the Grid
Problem: Information Collected via ITT API Is Not Available When Attaching to a Process
Problem: No GPU Utilization Data Is Collected
Problem: Same Functions Are Compared As Different Instances
Problem: Skipped Stack Frames
Problem: Stack in the Top-Down Tree Window Is Incorrect
Problem: Stacks in Call Stack and Bottom-Up Panes Are Different
Problem: System Functions Appear in the User Functions Only Mode
Problem: VTune Profiler is Slow to Respond When Collecting or Displaying Data
Problem: VTune Profiler is Slow on X-Servers with SSH Connection
Problem: Unexpected Paused Time
Problem: {Unknown Timer} in the Platform Power Analysis Viewpoint
Problem: Unknown Critical Error Due to Disabled Loopback Interface
Problem: Unknown Frames
Problem: Unreadable Text on macOS*
Problem: Unsupported Microsoft* Windows* OS
Warnings about Accurate CPU Time Collection
Context Menu: Grid
Context Menus: Call Stack Pane
Context Menus: Project Navigator
Context Menus: Source/Assembly Window
Dialog Box: Binary/Symbol Search
Dialog Box: Source Search
Hot Keys
Menu: Customize Grouping
Menu: Intel VTune Profiler
Pane: Call Stack
Pane: Options - General
Pane: Options - Result Location
Pane: Options - Source/Assembly
Project Navigator
Pane: Timeline
Toolbar: Configure Analysis
Toolbar: Filter
Toolbar: Source/Assembly
Toolbar: Intel VTune Profiler
Window: Bandwidth - Platform Power Analysis
Window: Bottom-up
Window: Caller/Callee
Window: Cannot Find <file type> File
Window: Collection Log
Window: Compare Results
Window: Configure Analysis
Window: Core Wake-ups - Platform Power Analysis
Window: Correlate Metrics - Platform Power Analysis
Window: CPU C/P States - Platform Power Analysis
Window: Debug
Window: Event Count - Hardware Events
Window: Flame Graph
Window: Graphics - GPU Compute/Media Hotspots
Window: Graphics C/P States - Platform Power Analysis
Window: NC Device States - Platform Power Analysis
Window: Platform
Window: Platform Power Analysis
Window: Sample Count - Hardware Events
Window: SC Device States - Platform Power Analysis
Window: Summary
Window: System Sleep States - Platform Power Analysis
Window: Temperature/Thermal Sample - Platform Power Analysis
Window: Timer Resolution - Platform Power Analysis
Window: Top-down Tree
Window: Uncore Event Count - Hardware Events
Window: Wakelocks - Platform Power Analysis
Window: Summary - Input and Output Summary
Window: Summary - Microarchitecture Exploration
Window: Summary - GPU Analysis
Window: Summary - Hardware Events
Window: Summary - Hotspots by CPU Utilization
Analysis Metrics
Top Hotspots
Top Tasks
Effective CPU Utilization Histogram
Frame Rate Histogram
Collection and Platform Info
Window: Summary - HPC Performance Characterization
Window: Summary - Memory Consumption
Window: Summary - Memory Usage
Window: Summary - Platform Power Analysis
Average Time
Computing Threads Started
Computing Threads Started, Threads/sec
CPU Time
EU 2 FPU Pipelines Active
EU Array Active
EU Array Idle
EU Array Stalled/Idle
EU Array Stalled
EU IPC Rate
EU Send pipeline active
EU Threads Occupancy
Global
GPU EU Array Usage
GPU L3 Bound
GPU L3 Miss Ratio
GPU L3 Misses
GPU L3 Misses, Misses/sec
GPU Memory Read Bandwidth, GB/sec
GPU Memory Texture Read Bandwidth, GB/sec
GPU Memory Write Bandwidth, GB/sec
GPU Texel Quads Count, Count/sec
GPU Utilization
Instance Count
L3 Sampler Bandwidth, GB/sec
L3 Shader Bandwidth, GB/sec
LLC Miss Rate due GPU Lookups
LLC Miss Ratio due GPU Lookups
Local
Maximum GPU Utilization
Occupancy
PS EU Active %
PS EU Stall %
Ratio to Max Bandwidth, %
Ratio to Max Bandwidth, %
Ratio to Max Bandwidth, %
Render/GPGPU Command Streamer Loaded
Samples Blended
Samples Killed in PS, pixels
Samples Written
Sampler Busy
Sampler Is Bottleneck
Shared Local Memory Read Bandwidth, GB/sec
Shared Local Memory Write Bandwidth, GB/sec
SIMD Width
Size
Total, GB/sec
Total Time
Typed Memory Read Bandwidth, GB/sec
Typed Memory Write Bandwidth, GB/sec
Typed Reads Coalescence
Typed Writes Coalescence
Untyped Memory Read Bandwidth, GB/sec
Untyped Memory Write Bandwidth, GB/sec
Untyped Reads Coalescence
Untyped Writes Coalescence
VS EU Active
VS EU Stall
Visible to Intel only — GUID: GUID-387FDAB0-B102-47BB-BE7D-D87B5109C2E3
Window: Summary - Hotspots by CPU Utilization
Use the Summary window as your starting point of the performance analysis with the Intel® VTune™ Profiler. To access this window, select the Hotspots by CPU Utilization viewpoint and click the Summary sub-tab in the result tab.
Depending on the analysis type, the Summary window provides the following application-level statistics in the Hotspots by CPU Utilization viewpoint:
NOTE:
You may click the  Copy to Clipboard button to copy the content of the selected summary section to the clipboard.
Analysis Metrics
The Summary window displays a list of CPU metrics that help you estimate an overall application execution. For a metric description, hover over the corresponding question mark icon  to read the pop-up help. For metric values flagged as performance issues, hover over such a value for details:
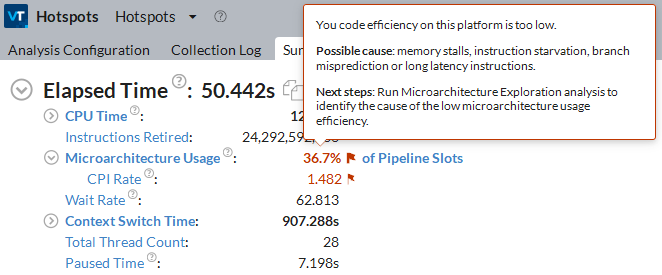
Use the Elapsed Time metric as your primary indicator and a baseline for comparison of results before and after optimization. Note that for multithreaded applications, the CPU Time is different from the Elapsed Time since the CPU Time is the sum of CPU time for all application threads.
For some analysis types, the Effective CPU Time is classified per CPU utilization as follows:
Utilization Type |
Description |
|---|---|
Idle |
Idle utilization. By default, if the CPU Time is insignificant (less than 50% of 1 CPU), such CPU utilization is classified as idle. |
Poor |
Poor utilization. By default, poor utilization is when the number of simultaneously running CPUs is less than or equal to 50% of the target CPU utilization. |
OK |
Acceptable (OK) utilization. By default, OK utilization is when the number of simultaneously running CPUs is between 51-85% of the target CPU utilization. |
Ideal |
Ideal utilization. By default, Ideal utilization is when the number of simultaneously running CPUs is between 86-100% of the target CPU utilization. |
The Overhead and Spin Time metrics, if provided (depend on the analysis), can tell you how your application's use of synchronization and threading libraries is impacting the CPU time. Review the metrics within these categories to learn where your application might be spending additional time making calls to synchronization and threading libraries such as system synchronization API, Intel® oneAPI Threading Building Blocks(oneTBB ), and OpenMP*. VTune Profiler provides the following types of inefficiencies in your code taking CPU time:
Imbalance or Serial Spinning Time |
Imbalance or Serial Spinning time is CPU time when working threads are spinning on a synchronization barrier consuming CPU resources. This can be caused by load imbalance, insufficient concurrency for all working threads or waits on a barrier in the case of serialized execution. |
Lock Contention Spin Time |
Lock Contention time is CPU time when working threads are spinning on a lock consuming CPU resources. High metric value may signal inefficient parallelization with highly contended synchronization objects. To avoid intensive synchronization, consider using reduction, atomic operations or thread local variables where possible. |
Other Spin Time |
This metric shows unclassified Spin time spent in a threading runtime library. |
Creation Overhead Time |
Creation time is CPU time that a runtime library spends on organizing parallel work. |
Scheduling Overhead Time |
Scheduling time is CPU time that a runtime library spends on work assignment for threads. If the time is significant, consider using coarse-grain work chunking. |
Reduction Overhead Time |
Reduction time is CPU time that a runtime library spends on loop or region reduction operations. |
Atomics Overhead Time |
Atomics time is CPU time that a runtime library spends on atomic operations. |
Other Overhead Time |
This metric shows unclassified Overhead time spent in a threading runtime library. |
Depending on the analysis type, the VTune Profiler may analyze a metric, compare its value with the threshold value provided by Intel architects, and highlight the metric value in pink as a performance issue for an application as a whole. The issue description for such a value may be provided below the critical metric or when you hover over the highlighted metric.
Each metric in the list shows up as a hyperlink. Clicking a hyperlink opens the Bottom-up window and sorts the grid by the selected metric or highlights the selected object in the grid.
Top Hotspots
VTune Profiler displays the most performance-critical functions and their CPU Time in the Top Hotspots section. Optimizing these functions typically results in improving overall application performance. Clicking a function in the list opens the Bottom-up window with this function selected.
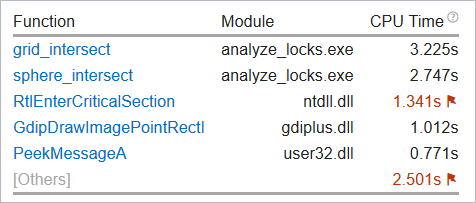
The grayed-out [Others] module, if provided, displays the total value for all other functions in the application that are not included into this table.
NOTE:
You can control the number of objects in this list and displayed metrics via the viewpoint configuration file.
Top Tasks
This section provides a list of tasks that took most of the time to execute, where tasks are either code regions marked with Task API, or system tasks enabled to monitor Ftrace* events, Atrace* events, Intel Media SDK programs, OpenCL™ kernels, and so on.
Clicking a task type in the table opens the grid view (for example, Bottom-up or Event Count) grouped by the Task Type granularity. See Task Analysis for more information.
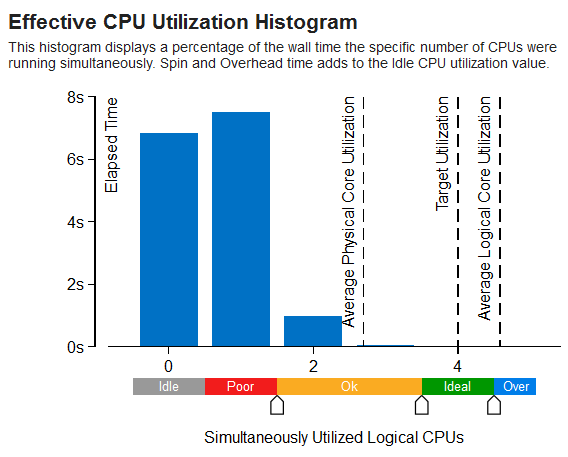
Effective CPU Utilization Histogram
Explore the Effective CPU Utilization Histogram to analyze the percentage of the wall time the specific number of logical CPUs were running simultaneously. Spin and Overhead Time adds to the Idle CPU Utilization value.
| Use This | To Do This |
|---|---|
Vertical bars |
Hover over the bar to identify the amount of Elapsed time the application spent using the specified number of logical CPU cores. |
Target Utilization |
Identify the target CPU utilization. This number is equal to the number of logical CPU cores. Consider this number as your optimization goal. |
Average Effective CPU Utilization |
Identify the average number of CPUs used aggregating the entire run. It is calculated as CPU time / Elapsed time. CPU utilization at any point in time cannot surpass the available number of logical CPU cores. Even when the system is oversubscribed, and there are more threads running then CPUs, the CPU utilization is the same as the number of CPUs. Use this number as a baseline for your performance measurements. The closer this number to the number of logical CPU cores, the better, except for the case when the CPU time goes to spinning. |
Utilization Indicator bar |
Analyze how the various utilization levels map to the number of simultaneously utilized logical CPU cores.
NOTE:
In the CPU Utilization histogram, the VTune Profiler treats the Spin and Overhead time as Idle CPU utilization. Different analysis types may recognize Spin and Overhead time differently depending on availability of call stack information. This may result in a difference of CPU utilization graphical representation per analysis type. |
Frame Rate Histogram
If you used the Frame API to mark the start and finish of the code regions executed repeatedly (frames) in your graphics application, the VTune Profiler analyzes this data and helps you identify regions that ran slowly. Explore the Frame Rate Histogram section and identify slow and fast frame domains.
Use This |
To Do This |
|---|---|
Domain drop-down menu |
Choose a frame domain to analyze with the frame rate histogram. If only one domain is available, the drop-down menu is grayed out. Then, you can switch to the Bottom-up window grouped by Frame Domain, filter the data by slow frames and switch to the Function grouping to identify functions in the slow frame domains. Try to optimize your code to keep the frame rate constant (for example, from 30 to 60 frames per second). |
Vertical bars |
Hover over a bar to see the total number of frames in your application executed with a specific frame rate. High number of slow or fast frames signals a performance bottleneck. |
Frame rate bar |
Use the sliders to adjust the frame rate threshold (in frames per second) for the currently open result and all subsequent results in the project. |
Collection and Platform Info
This section provides the following data:
Application Command Line |
Path to the target application. |
Operating System |
Operating system used for the collection. |
Computer Name |
Name of the computer used for the collection. |
Result Size |
Size of the result collected by the VTune Profiler. |
Collection start time |
Start time (in UTC format) of the external collection. Explore the Timeline pane to track the performance statistics provided by the custom collector over time. |
Collection stop time |
Stop time (in UTC format) of the external collection. Explore the Timeline pane to track the performance statistics provided by the custom collector over time. |
Collector type |
Type of the data collector used for the analysis. The following types are possible:
|
CPU Information |
|
Name |
Name of the processor used for the collection. |
Frequency |
Frequency of the processor used for the collection. |
Logical CPU Count |
Logical CPU count for the machine used for the collection. |
Physical Core Count |
Number of physical cores on the system. |
User Name |
User launching the data collection. This field is available if you enabled the per-user event-based sampling collection mode during the product installation. |
GPU Information |
|
Name |
Name of the Graphics installed on the system. |
Vendor |
GPU vendor. |
Driver |
Version of the graphics driver installed on the system. |
Stepping |
Microprocessor version. |
EU Count |
Number of execution units (EUs) in the Render and GPGPU engine. This data is Intel® HD Graphics and Intel® Iris® Graphics (further: Intel Graphics) specific. |
Max EU Thread Count |
Maximum number of threads per execution unit. This data is Intel Graphics specific. |
Max Core Frequency |
Maximum frequency of the Graphics processor. This data is Intel Graphics specific. |
Graphics Performance Analysis |
GPU metrics collection is enabled on the hardware level. This data is Intel Graphics specific.
NOTE:
Some systems disable collection of extended metrics such as L3 misses, memory accesses, sampler busyness, SLM accesses, and others in the BIOS. On some systems you can set a BIOS option to enable this collection. The presence or absence of the option and its name are BIOS vendor specific. Look for the Intel® Graphics Performance Analyzers option (or similar) in your BIOS and set it to Enabled. |
Parent topic: Window: Summary