A newer version of this document is available. Customers should click here to go to the newest version.
Visible to Intel only — GUID: GUID-3483B790-B1F7-42B4-9B37-9CB076C714FD
Visible to Intel only — GUID: GUID-3483B790-B1F7-42B4-9B37-9CB076C714FD
Window: Event Count - Hardware Events
Use the Event Count window to analyze the event count for PMU (Performance Monitoring Unit) events.
Depending on the analysis type or viewpoint, the Event Count window may include the following panes:
Event Count Pane
The Event Count pane attributes the Hardware Event Count by Hardware Event Type to program units. The Hardware Event Count metric estimates the number of times an event occurred during the collection.
By default, the data in the grid is sorted by the Clockticks event.
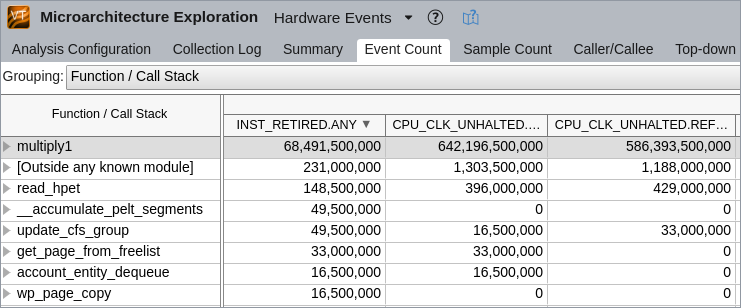
The list of hardware events depends on the analysis type. You may right-click an event column and select the What's This Column context menu option to open the description of the selected event.
When you explore the hardware events statistics for a result, you may drag and drop the columns in the grid for your convenience. VTune Profiler automatically saves your preferences and keeps the columns order for subsequent result views.
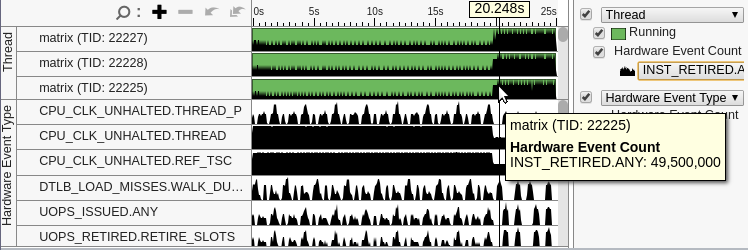
Timeline Pane
The Timeline pane is synchronized with the Event Count pane. The Thread area of the Timeline pane shows the number of times the selected event (CPU_CLK_UNHALTED.REF_TSC in the example below) occurred while a thread was running. You may use the Hardware Event Count drop-down menu in the legend area to choose a different event.
The Hardware Event Type area shows the application-level performance per each event.
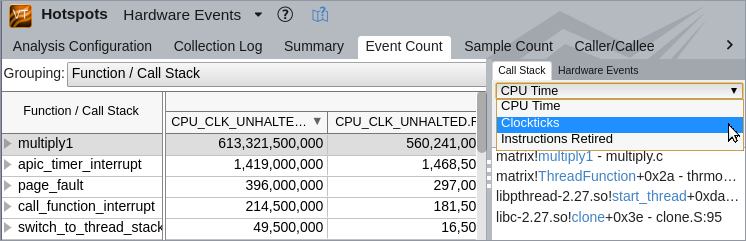
Call Stack Pane
If you selected the Collect stacks option for the hardware event-based sampling analysis (for example, Hotspots), the VTune Profiler provides the Call Stack pane. Use this pane to navigate between stacks and analyze the distribution of the event count for the object selected in the Event Count pane. For the example below, you select the Clockticks event to see stacks leading to the multiply1 function and contributing to the Clockticks event count. You can use this data to identify the most performance-critical stacks with the highest contribution to the object's Clockticks event count.