A newer version of this document is available. Customers should click here to go to the newest version.
Visible to Intel only — GUID: GUID-E24C55AA-2B4A-4885-B006-E3951A8CE87D
Visible to Intel only — GUID: GUID-E24C55AA-2B4A-4885-B006-E3951A8CE87D
Window: Bandwidth - Platform Power Analysis
To access this window: Select the Platform Power Analysis viewpoint and click the Bandwidth sub-tab in the result tab.
Use the Bandwidth window to:
- Analyze the transaction rate for byte reads and writes.
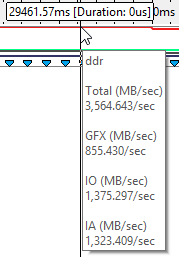
- View an approximation of the different bandwidth types used by each component during collection (IA, GFX, IO).
- Review the DDR SDRAM memory events and bandwidth usage over time.
Platform Power Analysis viewpoint is available as part of energy analysis. Collecting energy analysis with Intel® SoC Watch is available for target Android*, Windows*, or Linux* devices. Import and viewing of the Intel SoC Watch results is supported with any version of the VTune Profiler.
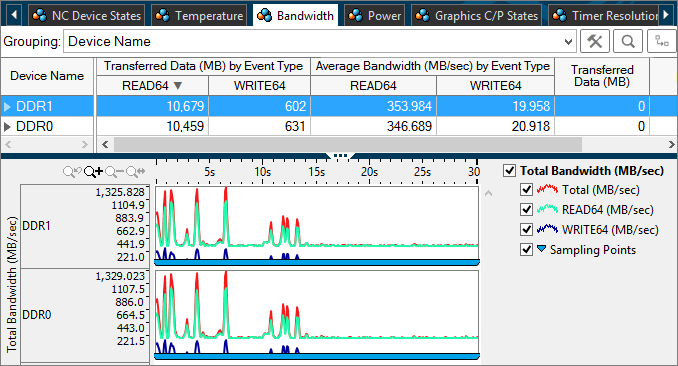
Bandwidth Pane
The Bandwidth pane displays the bandwidth values for the data collected. Bandwidth data is collected as byte counts and is displayed as MB/sec. The bandwidth is given in both total values and the average bandwidth by event type and component. You can change the unit displayed by right-clicking a data cell and selecting the Show Data As option to select an alternate unit.
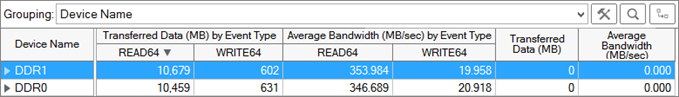
The average bandwidth displayed in this pane is typically the most important metric used to determine bandwidth usage during collection. The other columns display the number of bytes transferred by event and by the device or component.
There are two types of bandwidth data that can be collected: approximate bandwidth and detailed bandwidth. Approximate bandwidth is measured across all devices with a lower level of detail. Detailed bandwidth allows in-depth collection for the specified device and events related to that device. The type of bandwidth collected is specified when running the Intel SoC Watch collector. For more information about the options to use for detailed bandwidth collection, see the Intel SoC Watch User's Guide for the operating system of your target device.
Timeline Pane
Use the Timeline pane to view bandwidth changes over time. Expand the timeline vertically to improve the data visualization and see more bandwidth values. Consider removing the Sampling Points from the timeline while viewing the full timeline to improve visibility to the lowest bandwidth values. You can add the sampling values again after zooming in on a section of the timeline.
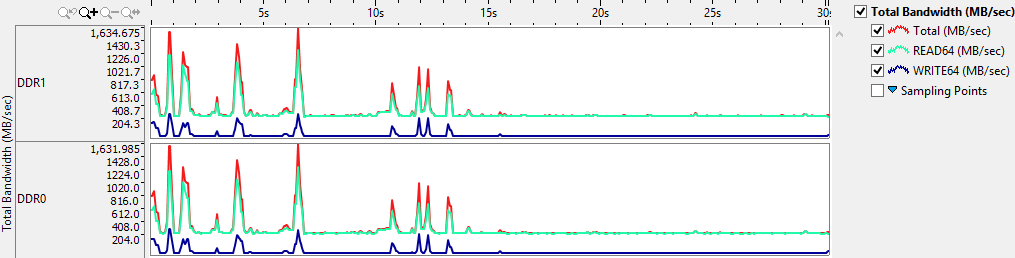
Hover over the timeline to view a tooltip listing the exact bandwidth values at that time during the collection (MB/sec). The blue sampling points indicate the time at which the sample is obtained from the hardware. The duration between sampling points is the sampling interval that was specified at collection time.
Filters applied on a timeline in one window are applied on all other windows within the viewpoint. This is useful if you identify an issue on one tab and want to see how the issue impacts the metrics shown on a different tab.