A newer version of this document is available. Customers should click here to go to the newest version.
Visible to Intel only — GUID: GUID-75AE0291-17FB-4E99-8C4F-7A69F030D21E
Visible to Intel only — GUID: GUID-75AE0291-17FB-4E99-8C4F-7A69F030D21E
Toolbar: Filter
Use the Filter toolbar to filter the data displayed in the grid or Timeline pane. Filtering settings applied to the currently opened result are saved for the whole project and automatically applied to the subsequent results in this project.
Use This |
To Do This |
|---|---|
Metric filter |
Mouse over the
By default, you see 100% of all metric data collected in the result. Metric values vary with a viewpoint and analysis type. For example, for the Hotspots viewpoint available for the Hotspots analysis result (hardware event-based sampling mode) there are CPU Time and Instructions Retired event metrics available, where the CPU Time is selected by default. Open any filtering drop-down menu to see the percentage of the CPU Time each module/process/thread introduces into the overall CPU Time for the result:
If you select a program unit in the filtering drop-down menu, your grid and Timeline view will be filtered out to display data for this particular program unit. For example, if you select the analyze_locks process introducing 53.4% of the CPU Time, the result data will display statistics for this process only and the Filter bar provides an indicator that only 53.4% of the CPU Time data is currently displayed:  |
Module filter |
Select a module to filter the collected data by its contribution. All data related to other modules is hidden. By default Any Module is selected. This option does not filter any data. |
Thread filter |
Select a thread to filter the collected data by its contribution. All data related to other threads is hidden. By default Any Thread is selected. This option does not filter any data. |
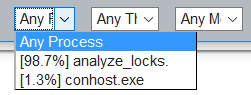
Process filter |
Select a process to filter the collected data by its contribution. All data related to other processes is hidden. By default Any Process is selected. This option does not filter any data. |
Thread Efficiency filter |
Select a thread efficiency level to filter the collected data by its contribution. All data related to other efficiency levels is hidden. By default Any Thread Efficiency is selected. This option does not filter any data. This filter is applied to the Hotspots by Thread Concurrency and Threading Efficiency viewpoints for user-mode sampling and tracing analysis results. |
Utilization filter |
Filter data in the grid by available CPU utilization modes. This filter is applied to the Hotspots by CPU Utilization viewpoint for the user-mode sampling and tracing analysis results. |
Sleep States filter |
Select a sleep state (C0 - Cn) to filter the collected data by its contribution. The deeper the sleep state of the CPU is, the greater power savings are. This filter is available for Energy analysis results only. |
Wake-up Reason filter |
Filter data by types of the objects that force the processor to wake up. Possible wake-up reasons are timer, interrupt, IPI, and so on. This filter is available for Energy analysis results only. |
Timer Type filter |
Filter data by type of the timers that force the processor to wake up. Choose between User and Kernel Timers. This filter is available for Energy analysis results only. |
|
Remove all filters and view all the available data. |
Inline Mode option |
Enable/Disable displaying performance data per inline functions. This option is available if information about inline functions is available in debug information generated by compilers. See View Data on Inline Functions for supported compilers and options. |
Call Stack Mode option |
Select whether to show system functions:
|
Loop Mode option |
Select a type of hierarchy to display loop data in the grid. The following types are available:
|
 Filter icon to enable the metric drop-down menu and select a filtering metric:
 Clear Filter icon
 If you applied filters available on the Filter bar to the data already filtered with the Filter In/Out by Selection context menu options, all filters are combined and applied simultaneously.