Visible to Intel only — GUID: GUID-3E9842D3-B89E-451B-8579-AE62B7634A8D
Visible to Intel only — GUID: GUID-3E9842D3-B89E-451B-8579-AE62B7634A8D
Analyze DPDK Applications
Use the Input and Output analysis of Intel® VTune™ Profiler to profile DPDK applications and collect batching statistics for polling threads performing Rx and event dequeue operations.
To profile a DPDK application using VTune Profiler, make sure DPDK is built with VTune Profiler options enabled. See the DPDK guide for more information.
When profiling DPDK as FD.io VPP plugin, modify DPDK_MESON_ARGS variable in build/external/packages/dpdk.mk with the same flags as described in Profiling with VTune section.
DPDK statistics collection is not supported for FreeBSD* targets and is not available in Profile System mode.
Analyze Rx Batch Statistics
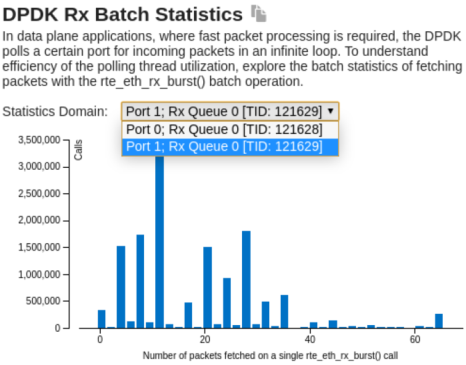
Start with the Summary tab and explore the DPDK Rx Batch Statistics histogram to get summary statistics for packet batches retrieving and to get a full characterization of core utilization on Rx. The histogram is available for each polling thread associated with a specific Rx queue:

Analyze Rx Spin Time
While the polling loop is running on a core, the CPU Time metric for this core is always close to 100%, regardless of how many loop cycles DPDK spends in an idle state. Therefore, the CPU Time metric cannot be used to reliably identify how the core is utilized on packet retrieval. For this polling model, a better utilization indicator might be the Rx Spin Time value, which is the ratio of wasted polling loop cycles. Wasted cycles are loop iterations during which DPDK does not receive any packets.
The DPDK Rx Spin Time metric shows the ratio of polling cycles fetching no packets, or the number rte_eth_rx_burst() calls that returned zero packets, to the total number of polling loop cycles:

Use the Platform tab to explore the DPDK Rx Spin Time metric on the timeline at per-thread basis:

To learn more about core utilization in DPDK applications, see the corresponding cookbook recipe.
Analyze DPDK Event Dequeue Statistics
Use the Input and Output analysis to collect DPDK eventdev dequeue batch statistics and analyze eventdev pipeline configuration efficiency.
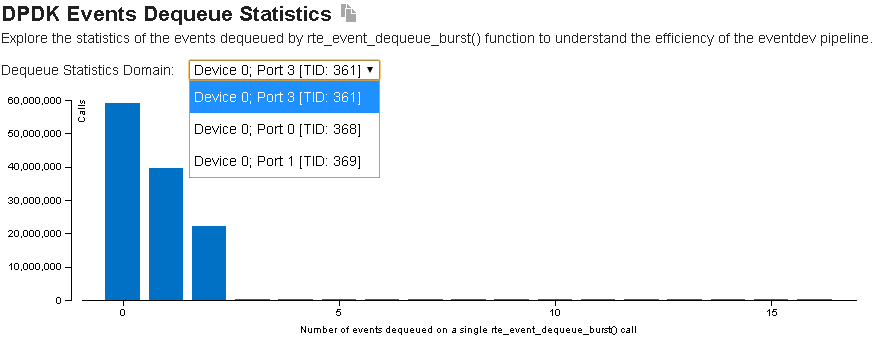
Start your investigation with the DPDK Events Dequeue Statistics section of the Summary tab:

This histogram shows batching statistics for packet (event) dequeue operation from the DPDK eventdev library. It provides statistics for each eventdev port, representing each worker thread that polls the event device. Explore the histogram to identify inhomogenous load distribution, oversubscribed, or underutilized worker threads.
Analyze DPDK Event Dequeue Spin Time
The DPDK Event Dequeue Spin Time metric represents the ratio of empty dequeue cycles, or the number of rte_event_dequeue_burst() calls that have returned zero events, with respect to the total number of dequeue calls:

Navigate to the Platform tab to explore the DPDK Event Dequeue Spin Time metric on the timeline. Per-worker dequeue statistics reveal details about load balancing, which enables you to analyze pipeline configuration efficiency and to identify underlying pipeline bottlenecks.

To learn more about the DPDK eventdev pipeline, see the DPDK Event Device Profiling Cookbook recipe.