A newer version of this document is available. Customers should click here to go to the newest version.
Visible to Intel only — GUID: GUID-8F59C3C3-F894-4593-A14E-5E51F556B0F5
Visible to Intel only — GUID: GUID-8F59C3C3-F894-4593-A14E-5E51F556B0F5
Input and Output Analysis
Use the Input and Output analysis of Intel® VTune™ Profiler to locate performance bottlenecks in I/O-intensive applications at both hardware and software levels.
The Input and Output analysis of Intel® VTune™ Profiler helps to determine:
- Platform I/O consumption by external PCIe devices and integrated accelerators:
- I/O bandwidth consumption, including Intel® Data Direct I/O Technology (Intel® DDIO) and Memory-Mapped I/O traffic.
- Utilization efficiency of Intel® DDIO
- Memory bandwidth consumption.
- Intel® Ultra Path Interconnect (Intel® UPI) bandwidth consumption.
- Software data plane utilization.
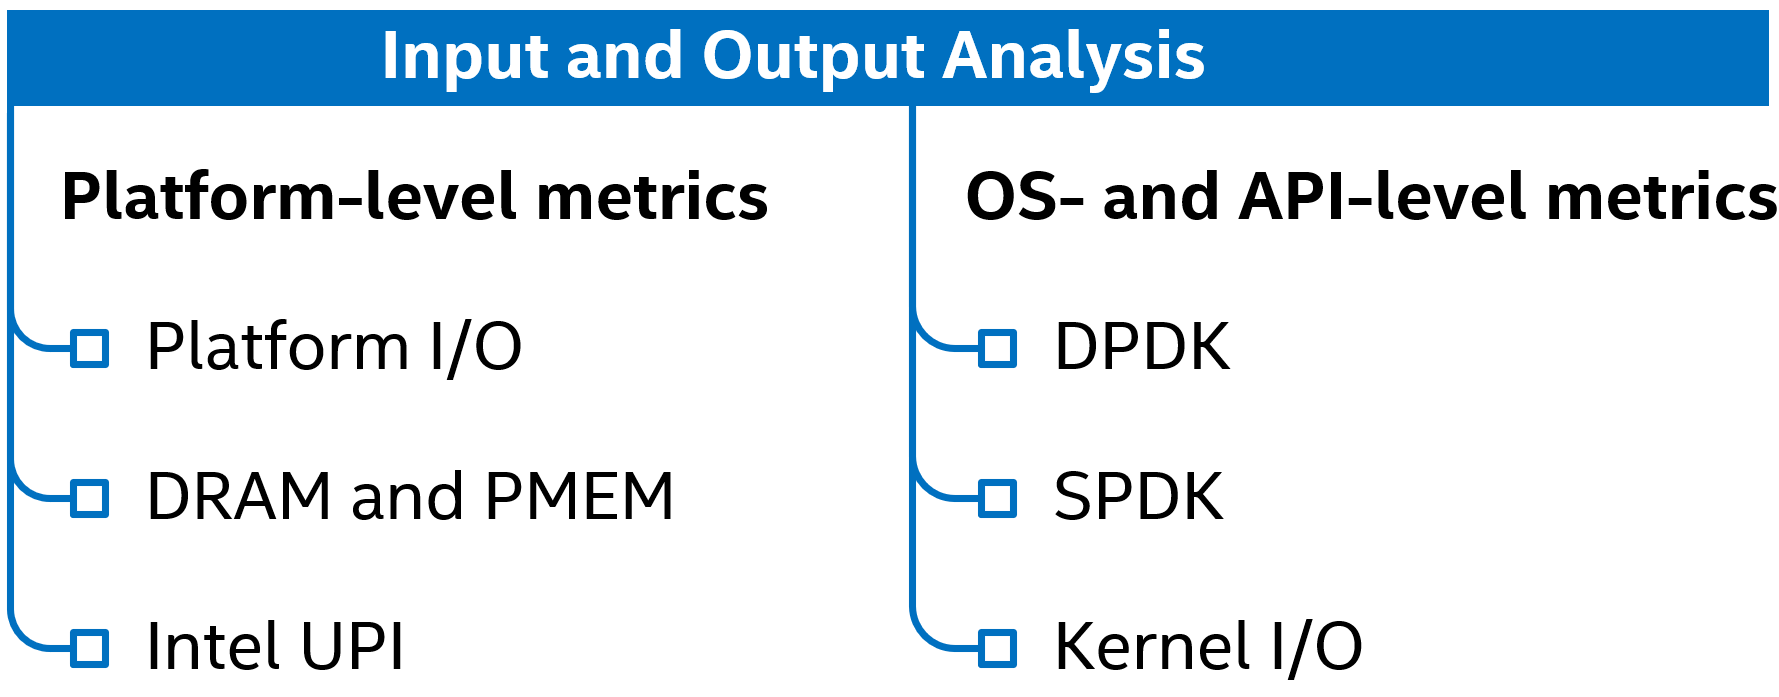
The Input and Output analysis features two main types of performance metrics:
- Platform-level metrics — application-agnostic hardware event-based metrics.
- OS- and API-specific metrics — performance metrics for software data planes—DPDK and SPDK—and the Linux* kernel I/O stack.
Linux* and FreeBSD* targets are supported.
The full set of Input and Output analysis metrics is available on Intel® Xeon® processors only.
Configure and Run Analysis
On FreeBSD systems, the graphical user interface of VTune Profiler is not supported. You can still configure and run the analysis from a Linux* or Windows* system using remote SSH capabilities, or collect the result locally from the CLI. For more information on available options, see FreeBSD Targets.
Launch VTune Profiler and, optionally, create a new project.
Click the Configure Analysis button.
In the WHERE pane, select the target system to profile.
In the HOW pane, select Input and Output.
In the WHAT pane, specify your analysis target (application, process, or system).
Depending on your target app and analysis purpose, choose any of the configuration options described in sections below.
- Click Start to run the analysis.
VTune Profiler collects the data, generates a result, and opens the result with that displays data according to configuration.
To run the Input and Output analysis from the command line, enter:
vtune -collect io [-knob <value>] -- <target> [target_options]
For details, see the io command line reference.
Platform-Level Metrics
To collect hardware event-based metrics, either load the Intel sampling driver or configure driverless hardware event collection (Linux targets only).
| IO Analysis Configuration Check Box | Features | Prerequisites/Applicability |
|---|---|---|
| Analyze PCIe traffic | Calculate inbound I/O (Intel® Data Direct I/O) and outbound I/O (Memory-Mapped I/O) bandwidth. | Available on server platforms based on Intel® microarchitecture code named Sandy Bridge EP and newer. The granularity of I/O bandwidth metrics depends on CPU model, collector used, and user privileges:
|
| Calculate L3 hits and misses of inbound I/O requests (Intel® DDIO hits/misses). | Available on server platforms based on Intel® microarchitecture code named Haswell and newer. The granularity of inbound I/O request L3 hit/miss metrics depends on CPU model, collector used and user privileges:
1—commonly, a set combines all devices sharing the same 16 PCIe lanes. |
|
| Calculate average latency of inbound I/O reads and writes, as well as CPU/IO conflicts. | Available on server platforms based on Intel® microarchitecture code named Skylake and newer. The granularity of latency and CPU/IO conflicts metrics depends on CPU model, collector used and user privileges:
1—commonly, a set combines all devices sharing the same 16 PCIe lanes. 2—average inbound I/O read latency is not available in driverless collection on Skylake, Cascade Lake, Cooper Lake servers. |
|
| Locate MMIO accesses | Locate code that induces outbound I/O traffic by accessing device memory through the MMIO address space. | Available on server platforms based on Intel® microarchitecture code named Skylake and newer.
|
| Analyze Intel® VT-d | Calculate performance metrics for Intel® Virtualization Technology for Directed I/O (Intel VT-d). | Available on server platforms based on Intel® microarchitecture code named Ice Lake and newer. The Intel VT-d metrics granularity depends on collector used and user privileges:
1—commonly, a set combines all devices sharing the same 16 PCIe lanes. |
| Analyze memory and cross-socket bandwidth | Calculate DRAM, Persistent Memory, and Intel® Ultra Path Interconnect (Intel® UPI) or Intel® QuickPath Interconnect (Intel® QPI) bandwidth. | While DRAM bandwidth data is always collected, persistent memory bandwidth and Intel® UPI / Intel® QPI cross-socket bandwidth data is only collected when applicable to the system. |
| Evaluate max DRAM bandwidth | Evaluate the maximum achievable local DRAM bandwidth before the collection starts. This data is used to scale bandwidth metrics on the Platform Diagram and timeline and to calculate thresholds. |
Not available on FreeBSD systems. |
OS- and API-Level Metrics
| IO Analysis Configuration Check Box | Prerequisites/Applicability |
|---|---|
| DPDK | Make sure DPDK is built with VTune Profiler support enabled. When profiling DPDK as FD.io VPP plugin, modify the DPDK_MESON_ARGS variable in build/external/packages/dpdk.mk with the same flags as described in Profiling with VTune section. Not available for FreeBSD targets. Not available in system-wide mode. |
| SPDK | Make sure SPDK is built using the --with-vtune advanced build option. When profiling in Attach to Process mode, make sure to set up the environment variables before launching the application. Not available in Profile System mode. |
| Kernel I/O | To collect these metrics, VTune Profiler enables FTrace* collection that requires access to debugfs. On some systems, this requires that you reconfigure your permissions for the prepare_debugfs.sh script located in the bin directory, or use root privileges. Not available for FreeBSD targets. |