A newer version of this document is available. Customers should click here to go to the newest version.
Visible to Intel only — GUID: GUID-AD95E29D-26B8-4D03-9967-0CEE23DB5571
Visible to Intel only — GUID: GUID-AD95E29D-26B8-4D03-9967-0CEE23DB5571
Intel® Threading Building Blocks Code Analysis
Use the Intel® VTune™ Profiler for performance analysis of application targets using Intel® oneAPI Threading Building Blocks(oneTBB ).
If you used the Intel® Runtime libraries in your application, you can run:
Hotspots and Threading analysis to explore the application parallelization efficiency based on oneTBB parallel or synchronization constructs.
Threading analysis to get detailed information on oneTBB synchronization objects that limited the parallel performance of your multithreaded application.
Using Intel C++ compiler is recommended to get more comprehensive diagnostics from the VTune Profiler.
Start exploration of oneTBB parallelization efficiency with Hotspots. Look at the Effective CPU Utilization Histogram to see the parallelization level of your application. Note that the histogram reflects the parallelization levels of your application based on the effective time spent subtracting time spent in threading runtimes.

If you see a significant portion of your elapsed time spent with Idle or Poor CPU utilization, explore the Top Hotspots table. Flagged oneTBB functions might mean that the application spends CPU time in the oneTBB runtime because of parallel inefficiencies like scheduling overhead or imbalance. To discover the reason, hover over the flag.
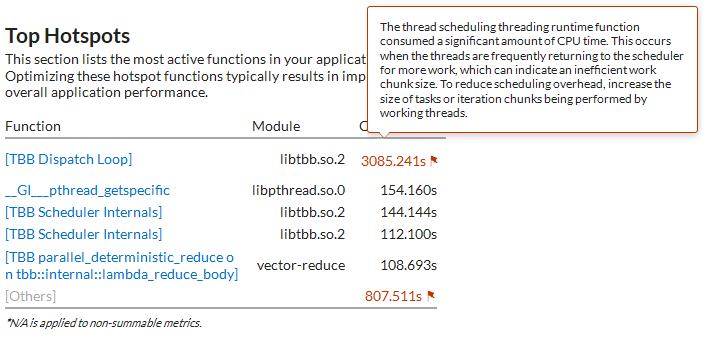
The Bottom-up tab can give you more details about synchronization or overhead in particular oneTBB constructs. Expand the Spin Time and Overhead Time columns in the grid to determine why a particular oneTBB runtime function had a higher than usual execution time. oneTBB runtime functions are flagged when they consume more than 5% of the CPU time.
For example, an oneTBB runtime function with a high Scheduling value may indicate that your application has threading work divided into small pieces, which leads to excessive scheduling overhead as the application calls to the runtime. You can resolve this issue by increasing the threading chunk size.

If there is an idle wait time when the oneTBB runtime does not burn the CPU on synchronization, it is useful to run the Threading analysis to explore synchronization bottlenecks that can prevent effective CPU utilization. VTune Profiler recognizes all types of Intel TBB synchronization objects. If you assign a meaningful name to an object you create in the source code, the VTune Profiler recognizes and represents it in the Result tab. For performance reasons, this functionality is not enabled by default in oneTBB headers. To make the user-defined objects visible to the VTune Profiler, recompile your application with TBB_USE_THREADING_TOOLS set to 1.
To display an overhead introduced by oneTBB library internals, the VTune Profiler creates a pseudo synchronization object TBB Scheduler that includes all waits from the oneTBB runtime libraries.