A newer version of this document is available. Customers should click here to go to the newest version.
Visible to Intel only — GUID: GUID-0CB31078-0989-422F-856B-0BC86FE47E1E
Visible to Intel only — GUID: GUID-0CB31078-0989-422F-856B-0BC86FE47E1E
Anomaly Detection View
Interpret results after performing Anomaly Detection analysis on your application. Identify performance anomalies by examining code regions of interest.
Use the Anomaly Detection view to interpret the results of an Anomaly Detection analysis. A typical workflow involves an examination in these areas:
View Data
Once you complete running Anomaly Detection on your application, the collected data displays in the Summary window.
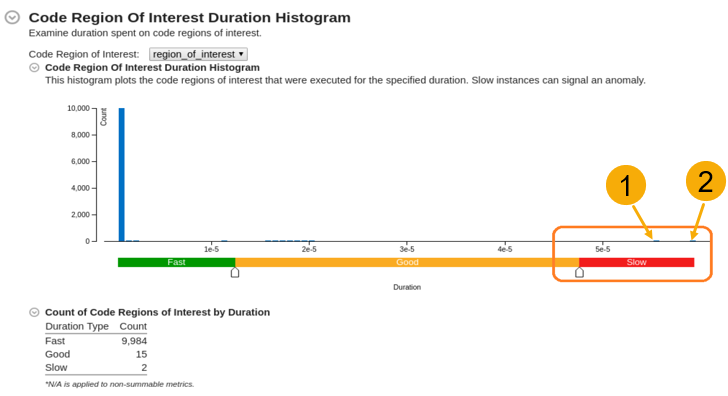
Start with the Code Region of Interest Duration Histogram. This shows the number of instances of a performance-critical task for a specific duration or latency (in ms).
Examine the histogram to see:
Code regions of interest
Information about regions where simulations executed faster or slower than normal
This diagram identifies unexpected performance outliers in the Slow region.
Load Details for Slow Region
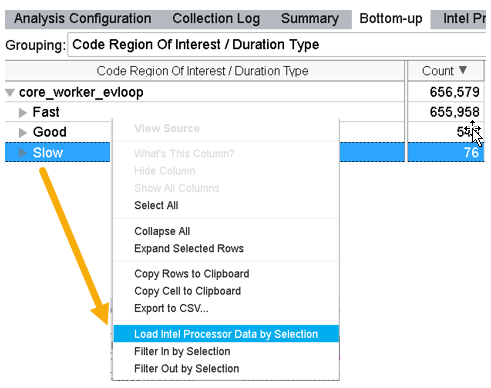
In the Bottom-up window, load details for the slow code regions of interest:
Switch to the Bottom-up window.
Group results by Code Region of Interest / Duration Type.
To further examine the outliers in the Slow region, right click on the Slow field and select Load Intel Processor Data by Selection.
This loads details about the code regions of interest in the Intel Processor Trace Details window.
Compare Processor Trace Details
Once you load trace data in the Intel Processor Trace Details window, you can compare trace details of individual instances of marked code regions by placing them side by side. The top of a stack represents the kernel entry point.
Metric |
Interpretation |
|---|---|
Instructions Retired, Call Count, Total Iteration Count |
Control flow metrics. Instructions Retired refers to the number of entries into a kernel. |
CPU Time (Kernel and User) |
Active time on the CPU. |
Wait Time, Inactive Time |
Duration for which a thread was idle because of synchronization or preemption. |
Elapsed Time |
Latency (Wall-clock time of the code region execution). |
Use this window as a hub to detect the following types of performance anomalies.
Context Switch Anomaly
Kernel-Induced Anomaly
Frequency Drops
Control Flow Deviation Anomaly
Context Switch Anomaly
In the Intel Processor Trace Details window, check the Inactive Time and Wait Time metrics. The Wait Time indicates the duration for which a thread was idle due to synchronization issues.
If the metrics are zero, the application had no context switches. Proceed to check for a different type of anomaly.
If the metrics are non-zero, continue with this procedure to check for context switches.
Sort the data by Wait Time.
For the instances that had significant Wait Time, compare the Wait Time with Elapsed Time. If the thread was idle for a considerable portion of elapsed time, this was due to a context switch synchronization issue. In this example, thread 25883 was idle for 1.269 out of 1.318 milliseconds, which is about 96% of the time.
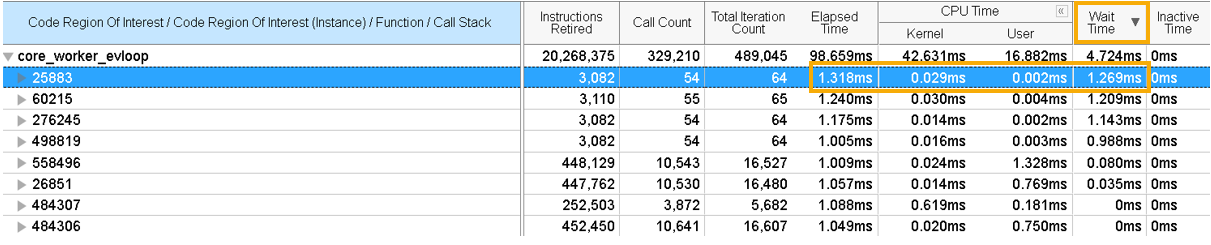
Expand the instance to drill down to a function or a stack. Identify the stack(s) that brought the thread to an idle state.
Kernel-Induced Anomaly
In the Intel Processor Trace Details window, sort the data by Kernel Time. The topmost element of the stack points to the entry point into the kernel. Where the ratio of kernel time to Elapsed Time is high, a significant amount of time was spent in the kernel. In this example, 566 out of 997 microseconds were spent in the kernel for the highlighted thread.
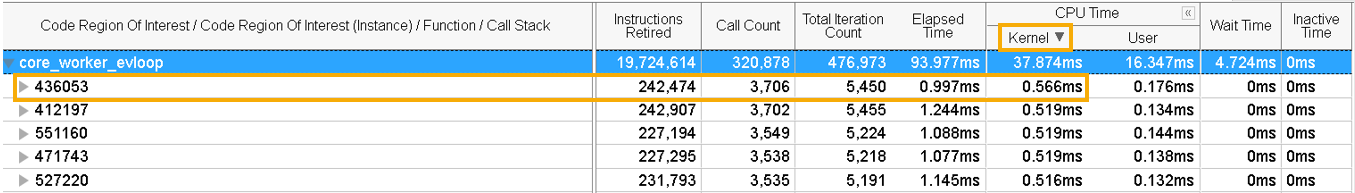
Expand the thread to see contributing stacks that could be responsible for long kernel times.
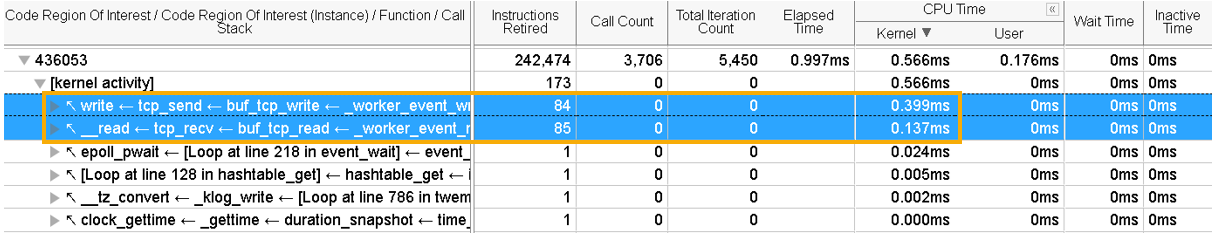
Due to the presence of dynamic code in the kernel and drivers, it is not possible to perform static processing of these binaries. The kernel_activity node at the top of the stack aggregates all performance data for kernel activity that happened during a specific instance of the Code Region of Interest.
Since kernel binaries are not processed, VTune Profiler cannot collect code flow metrics like Call Count, Iteration Count, or Instructions Retired. All these metrics are zero, except Instructions Retired, which indicates the number of entries into the kernel.
A possible explanation for a kernel-induced anomaly could be network speed. This could cause a slowdown when control goes to the kernel while receiving a request and sending a response over the network.
Frequency Drops
Find information about frequency drops in one of these windows:
- Bottom-up window: Shows frequency information for the entire application.
- Intel Processor Trace Details window: Shows frequency information only for the loaded region.
Frequency drops can happen due to several reasons:
There are Intel® Advanced Vector Extensions (Intel® AVX) instructions used inside or outside a loaded code region.
There are underlying hardware issues like cooling.
Apart from your application, low activity on the core and OS can also cause frequency drops. Look for high numbers of Inactive Time or Wait Time.
Control Flow Deviation Anomaly
When the Instructions Retired metric is unexpectedly huge for some threads, it indicates a control flow anomaly. A code deviation could have happened during execution of the code region.
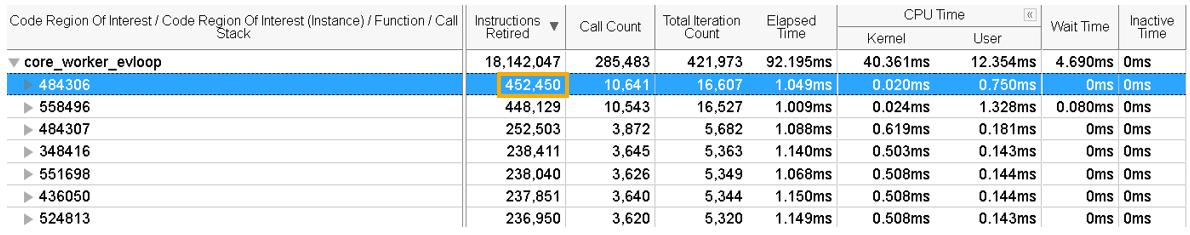
Select a node in the grid where you see a high value for Instructions Retired.
Right-click and select Filter In by Selection from the context menu.
Switch to the Caller/Callee window.
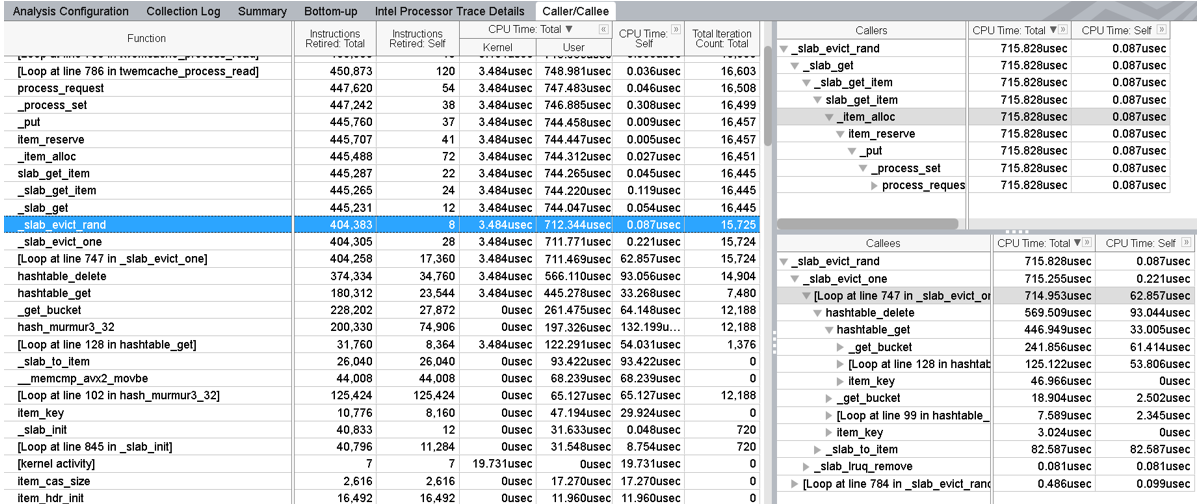
In the flat profile view, you can see functions annotated with Self and Total CPU Times. The caller view shows the callers of the selected function in a bottom-up representation. The callee view shows a call tree from the selected function in a top-down representation.
In this example, the function call to _slab_evict_one function from _slab_evict_rand causes a significant delay as evidenced by the Self CPU Time.
This is an alternative method to identify deviations in the control flow.
Check the Total Iteration Count to compare the number of loop iterations between a fast and slow iteration.
If the slower iteration has a higher iteration count, switch to Source Assembly view and examine the source code of the function.
Check to see if the slower iteration passed the validation of the cached element.
Both of these methods indicate the presence of a Cache Eviction, which can occur infrequently. While you may not be able to eliminate cache evictions entirely, you can minimize them through these ways:
- Increase the cache size.
- Update cache data and repeat the analysis.