Quartus® Prime Pro Edition User Guide: Platform Designer
ID
683609
Date
4/01/2024
Public
A newer version of this document is available. Customers should click here to go to the newest version.
Answers to Top FAQs
1. Creating a System with Platform Designer
2. Creating a Board Support Package with BSP Editor
3. Creating Platform Designer Components
4. Optimizing Platform Designer System Performance
5. Platform Designer Interconnect
6. Platform Designer System Design Components
7. Platform Designer Command-Line Utilities
8. Component Interface Tcl Reference
9. Quartus® Prime Pro Edition User Guide: Platform Designer Document Archives
A. Quartus® Prime Pro Edition User Guides
1.1. Platform Designer Interface Support
1.2. Platform Designer System Design Flow
1.3. Creating or Opening a Platform Designer System
1.4. Using the Board-Aware Flow in Platform Designer
1.5. Viewing a Platform Designer System
1.6. Adding IP Components to a System
1.7. Connecting System Components
1.8. Specifying Interconnect Parameters
1.9. Correcting Platform Designer System Timing Issues
1.10. Specifying Signal and Interface Boundary Requirements
1.11. Configuring Platform Designer System Security
1.12. Upgrading Outdated IP Components in Platform Designer
1.13. Synchronizing System Component Information
1.14. Validating System Integrity
1.15. Preserving System Elements for Debug
1.16. Generating a Platform Designer System
1.17. Generating Simulation Files for Platform Designer Systems and IP Variants
1.18. Adding a System to an Quartus® Prime Project
1.19. Managing Hierarchical Platform Designer Systems
1.20. Saving and Archiving Platform Designer Systems
1.21. Sharing Platform Designer Packaged Subsystems
1.22. Comparing Platform Designer Systems and IP components
1.23. Running System Scripts
1.24. Creating a System with Platform Designer Revision History
1.5.1. Viewing the System Hierarchy
1.5.2. Filtering the System View
1.5.3. Viewing Clock and Reset Domains
1.5.4. Viewing System Connections
1.5.5. Viewing Avalon® Memory-Mapped Domains in a System
1.5.6. Viewing the System Schematic
1.5.7. Customizing the Platform Designer Layout
1.5.8. Changing the Platform Designer Font
1.6.1. Modifying IP Parameters
1.6.2. Applying Preset Parameters for Specific Applications
1.6.3. Creating IP Presets Targeting Specific Boards
1.6.4. Applying Presets After Migrating a Board
1.6.5. Adding Third-Party IP Components
1.6.6. Specifying IP Component Instantiation Options
1.6.7. Creating or Opening an IP Core Variant
1.16.1. Generation Dialog Box Options
1.16.2. Specifying the Generation ID
1.16.3. Disabling or Enabling Parallel IP Generation
1.16.4. Files Generated for Platform Designer Systems
1.16.5. Generating System Testbench Files
1.16.6. Generating Example Designs for IP Components
1.16.7. Incremental System Generation Example
1.16.8. Generating the HPS IP Component System View Description File
1.16.9. Generating Header Files for Host Components
1.21.1. User Personas for Packaged Subsystems
1.21.2. Terminology for Packaged Subsystems
1.21.3. Creating a New Packaged Subsystem
1.21.4. Specifying Additional Packaged Subsystem Files
1.21.5. Modifying the Packaged Subsystem Script
1.21.6. Instantiating a Packaged Subsystem
1.21.7. Revising a Packaged Subsystem
1.21.8. New Packaged Subsystem Dialog Box Options and Controls
3.1. Platform Designer Components
3.2. Design Phases of an IP Component
3.3. Creating IP Components in the Component Editor
3.4. Creating Generic Components in a System
3.5. Exporting HDL Parameters to a System
3.6. Scripting Wire-Level Expressions
3.7. Control Interfaces Dynamically with an Elaboration Callback
3.8. Control File Generation Dynamically with Parameters and a Fileset Callback
3.9. Create a Composed Component or Subsystem
3.10. Add Component Instances to a Static or Generated Component
3.11. Add IP RTL Core Generated from the Intel® oneAPI Base Toolkit
3.12. Creating Platform Designer Components Revision History
3.3.1. Save an IP Component and Create the _hw.tcl File
3.3.2. Edit an IP Component with the Platform Designer Component Editor
3.3.3. Specify IP Component Type Information
3.3.4. Create an HDL File in the Platform Designer Component Editor
3.3.5. Defining HDL Parameters in _hw.tcl
3.3.6. Declaring SystemVerilog Interfaces in _hw.tcl
3.3.7. Create an HDL File Using a Template in the Platform Designer Component Editor
3.3.8. Specify Synthesis and Simulation Files in the Platform Designer Component Editor
3.3.9. Add Signals and Interfaces in the Platform Designer Component Editor
3.3.10. Specify Parameters in the Platform Designer Component Editor
3.3.8.1. Specify HDL Files for Synthesis in the Platform Designer Component Editor
3.3.8.2. Analyze Synthesis Files in the Platform Designer Component Editor
3.3.8.3. Specify Files for Simulation in the Component Editor
3.3.8.4. Include an Internal Register Map Description in the .svd for Agent Interfaces Connected to an HPS Component
3.3.10.1. Valid Ranges for Parameters in the _hw.tcl File
3.3.10.2. Types of Platform Designer Parameters
3.3.10.3. Obtaining Device Trait Information Using PART_TRAIT System Information Parameter
3.3.10.4. Declare Parameters with Custom _hw.tcl Commands
3.3.10.5. Validate Parameter Values with a Validation Callback
4.1. Designing with Avalon® and AXI Interfaces
4.2. Using Hierarchy in Systems
4.3. Using Concurrency in Memory-Mapped Systems
4.4. Inserting Pipeline Stages to Increase System Frequency
4.5. Using Bridges
4.6. Increasing Transfer Throughput
4.7. Reducing Logic Utilization
4.8. Reducing Power Consumption
4.9. Reset Polarity and Synchronization in Platform Designer
4.10. Optimizing Platform Designer System Performance Design Examples
4.11. Optimizing Platform Designer System Performance Revision History
5.1. Memory-Mapped Interfaces
5.2. Avalon® Streaming Interfaces
5.3. Avalon® Streaming Credit Interfaces
5.4. Interrupt Interfaces
5.5. Clock Interfaces
5.6. Reset Interfaces
5.7. Conduits
5.8. Interconnect Pipelining
5.9. Error Correction Coding (ECC) in Platform Designer Interconnect
5.10. AMBA* 3 AXI Protocol Specification Support (version 1.0)
5.11. AMBA* 3 APB Protocol Specification Support (version 1.0)
5.12. AMBA* 4 AXI Memory-Mapped Interface Support (version 2.0)
5.13. AMBA* 4 AXI Streaming Interface Support (version 1.0)
5.14. AMBA* 4 AXI-Lite Protocol Specification Support (version 2.0)
5.15. Port Roles (Interface Signal Types)
5.16. Platform Designer Interconnect Revision History
5.1.1. Platform Designer Packet Format
5.1.2. Interconnect Domains
5.1.3. Avalon Host and AXI Manager Network Interfaces
5.1.4. Avalon Agent and AXI Subordinate Network Interfaces
5.1.5. Arbitration
5.1.6. Memory-Mapped Arbiter
5.1.7. Datapath Multiplexing Logic
5.1.8. Width Adaptation
5.1.9. Burst Adapter
5.1.10. Waitrequest Allowance Adapter
5.1.11. Read and Write Responses
5.1.12. Platform Designer Address Decoding
5.1.3.1. Avalon® Memory Mapped Host Agent
5.1.3.2. Avalon® Memory Mapped Host Translator
5.1.3.3. AXI Manager Agent
5.1.3.4. AXI Translator
5.1.3.5. APB Manager Agent
5.1.3.6. APB Subordinate Agent
5.1.3.7. APB Translator
5.1.3.8. AHB Subordinate Agent
5.1.3.9. Memory-Mapped Router
5.1.3.10. Memory-Mapped Traffic Limiter
5.6.4.3.1. Reset Sequencer Status Register
5.6.4.3.2. Reset Sequencer Interrupt Enable Register
5.6.4.3.3. Reset Sequencer Control Register
5.6.4.3.4. Reset Sequencer Software Sequenced Reset Assert Control Register
5.6.4.3.5. Reset Sequencer Software Sequenced Reset Deassert Control Register
5.6.4.3.6. Reset Sequencer Software Direct Controlled Resets
5.6.4.3.7. Reset Sequencer Software Reset Masking
5.12.1. Burst Support
5.12.2. QoS
5.12.3. Regions
5.12.4. Write Response Dependency
5.12.5. AWCACHE and ARCACHE
5.12.6. Width Adaptation and Data Packing in Platform Designer
5.12.7. Ordering Model
5.12.8. Read and Write Allocate
5.12.9. Locked Transactions
5.12.10. Memory Types
5.12.11. Mismatched Attributes
5.12.12. Signals
5.14.1. AMBA* 4 AXI-Lite Signals
5.14.2. AMBA* 4 AXI-Lite Optional Port Support and Interconnect
5.14.3. AMBA* 4 AXI-Lite Bus Width
5.14.4. AMBA* 4 AXI-Lite Outstanding Transactions
5.14.5. AMBA* 4 AXI-Lite IDs
5.14.6. Connections Between AMBA* 3 AXI, AMBA* 4 AXI and AMBA* 4 AXI-Lite
5.14.7. AMBA* 4 AXI-Lite Response Merging
5.15.1. AXI Manager Interface Signal Types
5.15.2. AXI Subordinate Interface Signal Types
5.15.3. AMBA* 4 AXI Manager Interface Signal Types
5.15.4. AMBA* 4 AXI Subordinate Interface Signal Types
5.15.5. AMBA* 4 AXI-Stream Manager and Subordinate Interface Signal Types
5.15.6. AMBA* 4 AXI-Lite Signal Support and Limitations
5.15.7. APB Interface Signal Types
5.15.8. Avalon® Memory Mapped Interface Signal Roles
5.15.9. Avalon® Streaming Interface Signal Roles
5.15.10. Avalon® Streaming Credit Interface Signal Roles
5.15.11. Avalon® Streaming Credit User Signals
5.15.12. Avalon® Clock Source Signal Roles
5.15.13. Avalon® Clock Sink Signal Roles
5.15.14. Avalon® Conduit Signal Roles
5.15.15. Avalon® Tristate Conduit Signal Roles
5.15.16. Avalon® Tri-State Agent Interface Signal Types
5.15.17. Avalon® Interrupt Sender Signal Roles
5.15.18. Avalon® Interrupt Receiver Signal Roles
6.1. Bridges
6.2. Error Response Slave Intel® FPGA IP
6.3. Tri-State Components
6.4. Avalon® Data Pattern Generator and Checker Intel® FPGA IP
6.5. Avalon® Streaming Splitter Intel® FPGA IP
6.6. Avalon® Streaming Delay Intel® FPGA IP
6.7. Avalon® Streaming Round Robin Scheduler Intel® FPGA IP
6.8. Avalon® Packets to Transactions Converter Intel® FPGA IP
6.9. Avalon® Streaming Pipeline Stage Intel® FPGA IP
6.10. Avalon® Streaming Multiplexer and Demultiplexer Intel® FPGA IP
6.11. Avalon® Streaming Single-Clock and Dual-Clock FIFO Intel® FPGA IP
6.12. Platform Designer System Design Components Revision History
6.1.1. Clock Bridge Intel® FPGA IP
6.1.2. Avalon® Memory Mapped Clock Crossing Bridge Intel® FPGA IP
6.1.3. Avalon® Memory Mapped Pipeline Bridge Intel® FPGA IP
6.1.4. Avalon® Memory Mapped Unaligned Burst Expansion Bridge Intel® FPGA IP
6.1.5. Bridges Between Avalon® and AXI Interfaces
6.1.6. AXI Bridge Intel® FPGA IP
6.1.7. AXI Timeout Bridge Intel® FPGA IP
6.1.8. Address Span Extender Intel® FPGA IP
6.4.4.1. data_source_reset()
6.4.4.2. data_source_init()
6.4.4.3. data_source_get_id()
6.4.4.4. data_source_get_supports_packets()
6.4.4.5. data_source_get_num_channels()
6.4.4.6. data_source_get_symbols_per_cycle()
6.4.4.7. data_source_get_enable()
6.4.4.8. data_source_set_enable()
6.4.4.9. data_source_get_throttle()
6.4.4.10. data_source_set_throttle()
6.4.4.11. data_source_is_busy()
6.4.4.12. data_source_fill_level()
6.4.4.13. data_source_send_data()
6.4.5.1. data_sink_reset()
6.4.5.2. data_sink_init()
6.4.5.3. data_sink_get_id()
6.4.5.4. data_sink_get_supports_packets()
6.4.5.5. data_sink_get_num_channels()
6.4.5.6. data_sink_get_symbols_per_cycle()
6.4.5.7. data_sink_get_enable()
6.4.5.8. data_sink_set enable()
6.4.5.9. data_sink_get_throttle()
6.4.5.10. data_sink_set_throttle()
6.4.5.11. data_sink_get_packet_count()
6.4.5.12. data_sink_get_error_count()
6.4.5.13. data_sink_get_symbol_count()
6.4.5.14. data_sink_get_exception()
6.4.5.15. data_sink_exception_is_exception()
6.4.5.16. data_sink_exception_has_data_error()
6.4.5.17. data_sink_exception_has_missing_sop()
6.4.5.18. data_sink_exception_has_missing_eop()
6.4.5.19. data_sink_exception_signalled_error()
6.4.5.20. data_sink_exception_channel()
6.11.1. Interfaces Implemented in FIFO Cores
6.11.2. Avalon® Streaming FIFO IP Operating Modes
6.11.3. Avalon® Streaming FIFO IP Buffer Fill Level
6.11.4. Almost-Full and Almost-Empty Thresholds to Prevent Overflow and Underflow
6.11.5. Avalon® Streaming Single Clock and Dual Clock FIFO IP Parameters
6.11.6. Avalon® Streaming Single-Clock FIFO IP Registers
7.1. Run the Platform Designer Editor with qsys-edit
7.2. Scripting IP Core Generation
7.3. Board-Aware Flow Scripting Support
7.4. Display Available IP Components with ip-catalog
7.5. Create an .ipx File with ip-make-ipx
7.6. Generate Simulation Scripts
7.7. Generate a Platform Designer System with qsys-script
7.8. Parameterizing an Instantiated IP Core after save_system Command
7.9. Validate the Generic Components in a System with qsys-validate
7.10. Generate an IP Component or Platform Designer System with quartus_ipgenerate
7.11. Generate an IP Variation File with ip-deploy
7.12. Archive and Extract Platform Designer Systems with qsys-archive
7.13. Apply Presets to a New Board
7.14. Platform Designer Scripting Command Reference
7.15. Platform Designer Scripting Property Reference
7.16. Platform Designer Command-Line Utilities Revision History
7.14.1.1. create_system
7.14.1.2. export_hw_tcl
7.14.1.3. get_device_families
7.14.1.4. get_devices
7.14.1.5. get_module_properties
7.14.1.6. get_module_property
7.14.1.7. get_project_properties
7.14.1.8. get_project_property
7.14.1.9. load_system
7.14.1.10. save_system
7.14.1.11. set_design_id
7.14.1.12. set_module_property
7.14.1.13. set_project_property
7.14.2.1. get_composed_connections
7.14.2.2. get_composed_connection_parameter_value
7.14.2.3. get_composed_connection_parameters
7.14.2.4. get_composed_instance_assignment
7.14.2.5. get_composed_instance_assignments
7.14.2.6. get_composed_instance_parameter_value
7.14.2.7. get_composed_instance_parameters
7.14.2.8. get_composed_instances
7.14.3.1. set_domain_assignment
7.14.3.2. get_domain_assignment
7.14.3.3. get_domain_assignments
7.14.3.4. set_interface_assignment
7.14.3.5. get_interface_assignment
7.14.3.6. get_interface_assignments
7.14.3.7. set_postadaptation_assignment
7.14.3.8. get_postadaptation_assignment
7.14.3.9. get_postadaptation_assignments
7.14.4.1. add_instance
7.14.4.2. apply_instance_preset
7.14.4.3. create_ip
7.14.4.4. add_component
7.14.4.5. duplicate_instance
7.14.4.6. enable_instance_parameter_update_callback
7.14.4.7. get_instance_assignment
7.14.4.8. get_instance_assignments
7.14.4.9. get_instance_documentation_links
7.14.4.10. get_instance_interface_assignment
7.14.4.11. get_instance_interface_assignments
7.14.4.12. get_instance_interface_parameter_property
7.14.4.13. get_instance_interface_parameter_value
7.14.4.14. get_instance_interface_parameters
7.14.4.15. get_instance_interface_port_property
7.14.4.16. get_instance_interface_ports
7.14.4.17. get_instance_interface_properties
7.14.4.18. get_instance_interface_property
7.14.4.19. get_instance_interfaces
7.14.4.20. get_instance_parameter_property
7.14.4.21. get_instance_parameter_value
7.14.4.22. get_instance_parameter_values
7.14.4.23. get_instance_parameters
7.14.4.24. get_instance_port_property
7.14.4.25. get_instance_properties
7.14.4.26. get_instance_property
7.14.4.27. get_instances
7.14.4.28. is_instance_parameter_update_callback_enabled
7.14.4.29. remove_instance
7.14.4.30. set_instance_parameter_value
7.14.4.31. set_instance_parameter_values
7.14.4.32. set_instance_property
7.14.5.1. add_instantiation_hdl_file
7.14.5.2. add_instantiation_interface
7.14.5.3. add_instantiation_interface_port
7.14.5.4. copy_instance_interface_to_instantiation
7.14.5.5. get_instantiation_assignment_value
7.14.5.6. get_instantiation_assignments
7.14.5.7. get_instantiation_hdl_file_properties
7.14.5.8. get_instantiation_hdl_file_property
7.14.5.9. get_instantiation_hdl_files
7.14.5.10. get_instantiation_interface_assignment_value
7.14.5.11. get_instantiation_interface_assignments
7.14.5.12. get_instantiation_interface_parameter_value
7.14.5.13. get_instantiation_interface_parameters
7.14.5.14. get_instantiation_interface_port_properties
7.14.5.15. get_instantiation_interface_port_property
7.14.5.16. get_instantiation_interface_ports
7.14.5.17. get_instantiation_interface_property
7.14.5.18. get_instantiation_interface_properties
7.14.5.19. get_instantiation_interface_sysinfo_parameter_value
7.14.5.20. get_instantiation_interface_sysinfo_parameters
7.14.5.21. get_instantiation_interfaces
7.14.5.22. get_instantiation_properties
7.14.5.23. get_instantiation_property
7.14.5.24. get_loaded_instantiation
7.14.5.25. import_instantiation_interfaces
7.14.5.26. load_instantiation
7.14.5.27. remove_instantiation_hdl_file
7.14.5.28. remove_instantiation_interface
7.14.5.29. remove_instantiation_interface_port
7.14.5.30. save_instantiation
7.14.5.31. set_instantiation_assignment_value
7.14.5.32. set_instantiation_hdl_file_property
7.14.5.33. set_instantiation_interface_assignment_value
7.14.5.34. set_instantiation_interface_parameter_value
7.14.5.35. set_instantiation_interface_port_property
7.14.5.36. set_instantiation_interface_sysinfo_parameter_value
7.14.5.37. set_instantiation_property
7.14.6.1. apply_component_preset
7.14.6.2. get_component_assignment
7.14.6.3. get_component_assignments
7.14.6.4. get_component_documentation_links
7.14.6.5. get_component_interface_assignment
7.14.6.6. get_component_interface_assignments
7.14.6.7. get_component_interface_parameter_property
7.14.6.8. get_component_interface_parameter_value
7.14.6.9. get_component_interface_parameters
7.14.6.10. get_component_interface_port_property
7.14.6.11. get_component_interface_ports
7.14.6.12. get_component_interface_property
7.14.6.13. get_component_interfaces
7.14.6.14. get_component_parameter_property
7.14.6.15. get_component_parameter_value
7.14.6.16. get_component_parameters
7.14.6.17. get_component_project_properties
7.14.6.18. get_component_project_property
7.14.6.19. get_component_property
7.14.6.20. get_loaded_component
7.14.6.21. load_component
7.14.6.22. reload_component_footprint
7.14.6.23. save_component
7.14.6.24. set_component_parameter_value
7.14.6.25. set_component_project_property
7.14.7.1. add_connection
7.14.7.2. auto_connect
7.14.7.3. get_connection_parameter_property
7.14.7.4. get_connection_parameter_value
7.14.7.5. get_connection_parameters
7.14.7.6. get_connection_properties
7.14.7.7. get_connection_property
7.14.7.8. get_connections
7.14.7.9. remove_connection
7.14.7.10. remove_dangling_connections
7.14.7.11. set_connection_parameter_value
7.14.8.1. add_interface
7.14.8.2. get_exported_interface_sysinfo_parameter_value
7.14.8.3. get_exported_interface_sysinfo_parameters
7.14.8.4. get_interface_port_property
7.14.8.5. get_interface_ports
7.14.8.6. get_interface_properties
7.14.8.7. get_interface_property
7.14.8.8. get_interfaces
7.14.8.9. get_port_properties
7.14.8.10. remove_interface
7.14.8.11. set_exported_interface_sysinfo_parameter_value
7.14.8.12. set_interface_port_property
7.14.8.13. set_interface_property
7.14.9.1. set_validation_property
7.14.9.2. sync_sysinfo_parameters
7.14.9.3. validate_component
7.14.9.4. validate_component_interface
7.14.9.5. validate_connection
7.14.9.6. validate_instance
7.14.9.7. validate_instance_interface
7.14.9.8. validate_system
7.14.9.9. validate_component_footprint
7.14.9.10. reload_component_footprint
7.14.10.1. auto_assign_base_addresses
7.14.10.2. auto_assign_irqs
7.14.10.3. auto_assign_system_base_addresses
7.14.10.4. get_parameter_properties
7.14.10.5. lock_avalon_base_address
7.14.10.6. send_message
7.14.10.7. set_use_testbench_naming_pattern
7.14.10.8. unlock_avalon_base_address
7.14.10.9. get_testbench_dutname
7.14.10.10. get_use_testbench_naming_pattern
7.15.1. Connection Properties
7.15.2. Design Environment Type Properties
7.15.3. Direction Properties
7.15.4. Element Properties
7.15.5. Instance Properties
7.15.6. Interface Properties
7.15.7. Message Levels Properties
7.15.8. Module Properties
7.15.9. Parameter Properties
7.15.10. Parameter Status Properties
7.15.11. Parameter Type Properties
7.15.12. Port Properties
7.15.13. Project Properties
7.15.14. System Info Type Properties
7.15.15. Units Properties
7.15.16. Validation Properties
7.15.17. Interface Direction
7.15.18. File Set Kind
7.15.19. Access Type
7.15.20. Instantiation HDL File Properties
7.15.21. Instantiation Interface Duplicate Type
7.15.22. Instantiation Interface Properties
7.15.23. Instantiation Properties
7.15.24. Port Properties
7.15.25. VHDL Type
8.1.1.1. add_interface
8.1.1.2. add_interface_port
8.1.1.3. get_interfaces
8.1.1.4. get_interface_assignment
8.1.1.5. get_interface_assignments
8.1.1.6. get_interface_ports
8.1.1.7. get_interface_properties
8.1.1.8. get_interface_property
8.1.1.9. get_port_properties
8.1.1.10. get_port_property
8.1.1.11. set_interface_assignment
8.1.1.12. set_interface_property
8.1.1.13. set_port_property
8.1.1.14. set_interface_upgrade_map
8.1.5.1. add_documentation_link
8.1.5.2. get_module_assignment
8.1.5.3. get_module_assignments
8.1.5.4. get_module_ports
8.1.5.5. get_module_properties
8.1.5.6. get_module_property
8.1.5.7. send_message
8.1.5.8. set_module_assignment
8.1.5.9. set_module_property
8.1.5.10. add_hdl_instance
8.1.5.11. package
8.1.6.1. add_instance
8.1.6.2. add_connection
8.1.6.3. get_connections
8.1.6.4. get_connection_parameters
8.1.6.5. get_connection_parameter_value
8.1.6.6. get_instances
8.1.6.7. get_instance_interfaces
8.1.6.8. get_instance_interface_ports
8.1.6.9. get_instance_interface_properties
8.1.6.10. get_instance_property
8.1.6.11. set_instance_property
8.1.6.12. get_instance_properties
8.1.6.13. get_instance_interface_property
8.1.6.14. get_instance_parameters
8.1.6.15. get_instance_parameter_property
8.1.6.16. get_instance_parameter_value
8.1.6.17. get_instance_port_property
8.1.6.18. set_connection_parameter_value
8.1.6.19. set_instance_parameter_value
8.1.7.1. add_fileset
8.1.7.2. add_fileset_file
8.1.7.3. set_fileset_property
8.1.7.4. get_fileset_file_attribute
8.1.7.5. set_fileset_file_attribute
8.1.7.6. get_fileset_properties
8.1.7.7. get_fileset_property
8.1.7.8. get_fileset_sim_properties
8.1.7.9. set_fileset_sim_properties
8.1.7.10. create_temp_file
8.2.1. Script Language Properties
8.2.2. Interface Properties
8.2.3. SystemVerilog Interface Properties
8.2.4. Instance Properties
8.2.5. Parameter Properties
8.2.6. Parameter Type Properties
8.2.7. Parameter Status Properties
8.2.8. Port Properties
8.2.9. Direction Properties
8.2.10. Display Item Properties
8.2.11. Display Item Kind Properties
8.2.12. Display Hint Properties
8.2.13. Module Properties
8.2.14. Fileset Properties
8.2.15. Fileset Kind Properties
8.2.16. Callback Properties
8.2.17. File Attribute Properties
8.2.18. File Kind Properties
8.2.19. File Source Properties
8.2.20. Simulator Properties
8.2.21. Port VHDL Type Properties
8.2.22. System Info Type Properties
8.2.23. Design Environment Type Properties
8.2.24. Units Properties
8.2.25. Operating System Properties
8.2.26. Quartus.ini Type Properties
7.1. Run the Platform Designer Editor with qsys-edit
The qsys-edit utility allows you to run the Platform Designer editor from command-line.
You can use the following options with the qsys-edit utility:
| Option | Usage | Description |
|---|---|---|
1st arg file |
Optional | Specifies the name of the .qsys system or .qvar variation file to edit. |
--search-path[=<value>] |
Optional | If you omit this command, Platform Designer uses a standard default path. If you provide a search path, Platform Designer searches a comma-separated list of paths. To include the standard path in your replacement, use "$", for example: /extra/dir,$. |
--quartus-project[=<value>] |
Required | This option is mandatory if you are associating your Platform Designer system with an existing Quartus® Prime project. Specifies the name of the Quartus® Prime project file. If you do not provide the revision via --rev , Platform Designer uses the default revision as the Quartus® Prime project name. |
--new-quartus-project[=<value>] |
Required | This option is mandatory if you are associating your Platform Designer system with a new Quartus® Prime project. Specifies the name and path of the new Quartus® Prime project. Creates a new Quartus® Prime project at the specified path. You can also provide the revision name. |
--rev[=<value>] |
Optional | Specifies the name of the Quartus® Prime project revision. |
--family[=<value>] |
Optional | Sets the device family. |
--part[=<value>] |
Optional | Sets the device part number. If set, this option overrides the --family option. |
--new-component-type[=<value>] |
Optional | Specifies the instance type for parameterization in a variation. |
--require-generation |
Optional | Marks the loading system as requiring generation. |
--debug |
Optional | Enables debugging features and output. |
--jvm-max-heap-size=<value> |
Optional | The maximum memory size that Platform Designer uses when running qsys-edit. You specify this value as <size><unit>, where unit is m (or M) for multiples of megabytes, or g (or G) for multiples of gigabytes. The default value is 512m. |
--metrics-log-file=[path_to_log_file] |
Optional | This switch creates a new file containing a set of metrics, at the path you specify. This switch must be used alongside the --record-metrics switch, or the switch does not function. The path to the log file must exist, or the FileDoesNotExists error appears. Platform Designer does not create any new directories listed in the path. |
--record-metrics[=<foobar>] |
Optional | Enables metric logging. This feature logs the time Platform Designer takes to perform various operations. The other information includes:
|
--help |
Optional | Displays help for qsys-edit. |
Important: The options --quartus-project and --new-quartus-project are mutually exclusive. If you use --quartus-project you cannot use --new-quartus-project and vice versa.
Extended Features with the --debug Options
The --debug option provides powerful tools for debugging. When you launch Platform Designer with the --debug option enabled, you can:
- View debug messages when opening a system or generating HDL for that system.
- Add the --verbose argument when generating IP or a system using command-line utilities.
- Access internal library components in the IP Catalog, for example, modules used to create interconnect fabric.
- Access to debug tools and files from the Internal menu.
Figure 283. Internal Menu Options
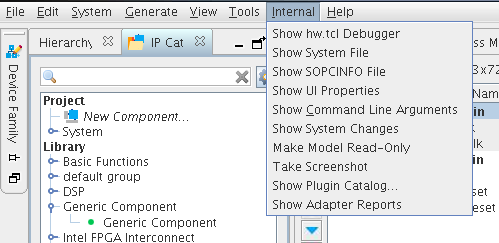
| Menu Item | Description |
|---|---|
| Show hw.tcl Debugger | Displays a Tcl debugger. |
| Show System File | Displays the current system XML in a text dialog box. |
| Show SOPCINFO File | Shows the SOPCINFO report XML in a text dialog box. |
| Show UI Properties | Displays the UI properties in a text dialog box. |
| Show Command Line Arguments | Displays all command-line arguments and environment variables in a text dialog box. |
| Show System Changes | Displays dynamic system changes in a text dialog box. |
| Make Model Read-only | Makes the system you are working in read-only. |
| Take Screenshots | Creates a .png file in the <project_directory> by default. You can navigate and save to a directory of your choice. |
| Show Plug-In Catalog | Displays library details such as type, version, tags, etc. for all IPs in the IP Catalog. |
| Show Adapter Reports | Displays adapter reports for any adapters added when transforming the system. |
- You can view detailed debugging messages in the Component Editor while building a custom IP component.
- You can view the generated Tcl script while editing in the Component Editor with the Advanced > Show Tcl for Component command.
- You can launch the System Console with debug logging.