External Memory Interfaces Cyclone® 10 GX FPGA IP User Guide
10.7.1.4.1. Daisy-Chaining Additional EMIF IP Cores for Debugging
If you don't require debug capabilities for a particular EMIF IP core, you do not have to connect that core to the daisy chain.
Example of Daisy-Chaining Multiple EMIF Cores
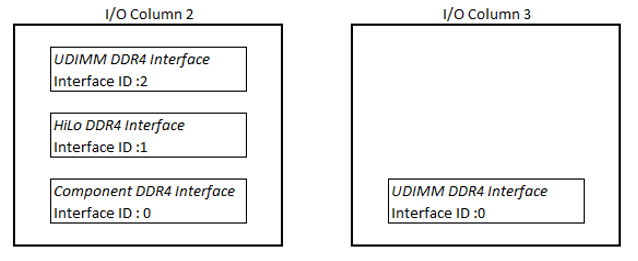
This example assumes a total of four EMIF IP cores, with three residing in column 2 and one residing in column 3. In this example, column 2 has a DDR3 component, HiLo, and UDIMM EMIF interfaces, and column 3 has a DDR3 UDIMM interface.
To create a daisy chain of EMIF IP cores, follow these steps:
- On the first EMIF IP core, select Add EMIF Debug Interface for EMIF Debug Toolkit/On-Chip Debug Port.
- Select Enable Daisy-Chaining for EMIF Debug Toolkit/On-Chip Debug Port to create an Avalon® -MM interface called cal_debug_out.
- Select First EMIF Instance in the Avalon® Chain.
- Set Interface ID to 0. You can start Interface ID at any number, so long as you select First EMIF Instance in the Avalon® for the first EMIF IP core in a column.
Figure 93. Calibration Debug Options for First EMIF IP Core (Component Interface)
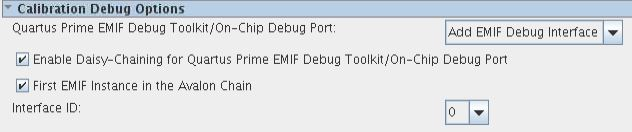 Figure 94. EMIF with EMIF Debug Interface and Daisy-Chaining Enabled
Subsequent EMIF IP cores in the same column require an incremental Interface ID value. For ease of use, you can start with an Interface ID value of 0 for the first EMIF IP core in a column. For two EMIF IP cores in two different columns, each IP core can have an Interface ID value beginning at 0, with the value incremented for each subsequent EMIF IP core in the same column.
- On the second EMIF IP core in the same column, select Export as the EMIF Debug Toolkit/On-Chip Debug Port mode, to export an Avalon® -MM interface called cal_debug. Also select the Enable Daisy-Chaining for EMIF Debug Toolkit/On-Chip Debug Port option.
Figure 95. Calibration Debug Options for the Second EMIF IP Core
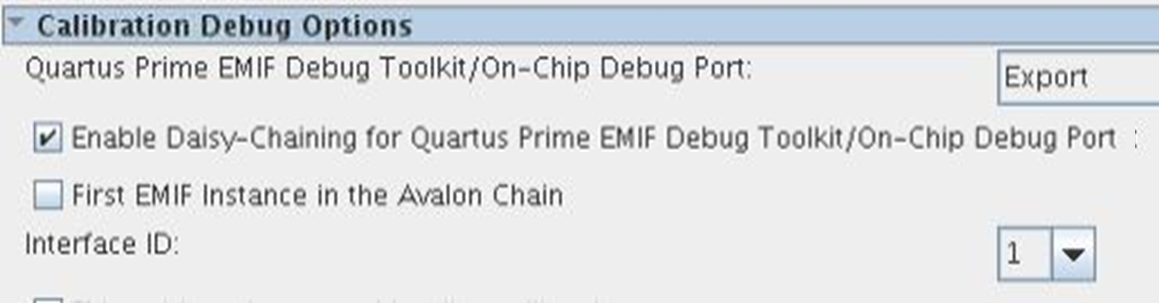 Figure 96.
 - On the last EMIF IP core in the same column, select Export as the EMIF Debug Toolkit/On-Chip Debug Port mode. For the last EMIF IP in the debug daisy chain, do not select the Enable Daisy-Chaining for EMIF Debug Toolkit/On-Chip Debug Port option.
Figure 97. Calibration Debug Options for the Last EMIF IP Core (UDIMM interface)
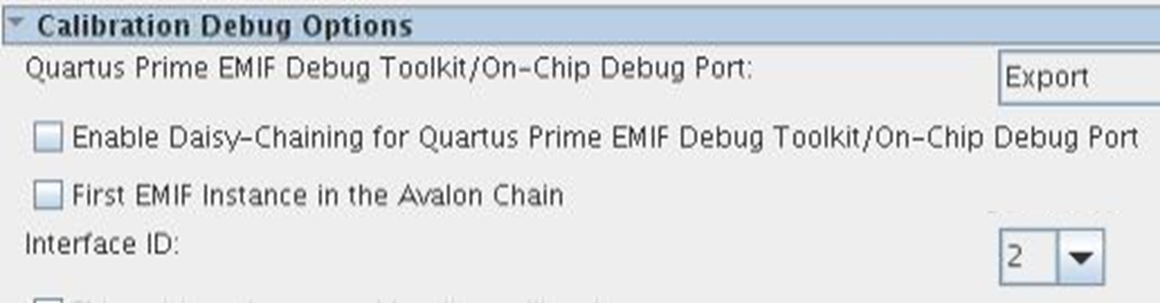 Figure 98. EMIF with EMIF Debug Interface Exported and Daisy-Chain Disabled
 - Connect the IP cores on I/O column 2 as shown below.
Figure 99. Daisy-Chain of Multiple EMIF IP Cores in I/O column 2
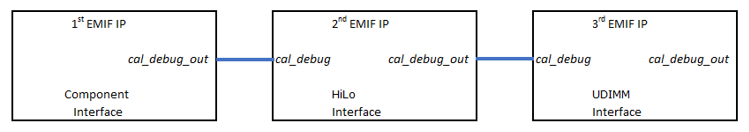
- Connect the cal_debug_out interface of the first EMIF IP core (the component interface in the above example) to the cal_debug interface of the second EMIF IP core (the HiLo interface in the above example).
- Connect the cal_debug_out interface of the second EMIF IP core (the HiLo interface in the above example) to the cal_debug interface of the third EMIF IP core (the UDIMM interface in the above example).
Figure 100. UDIMM Calibration Debug Options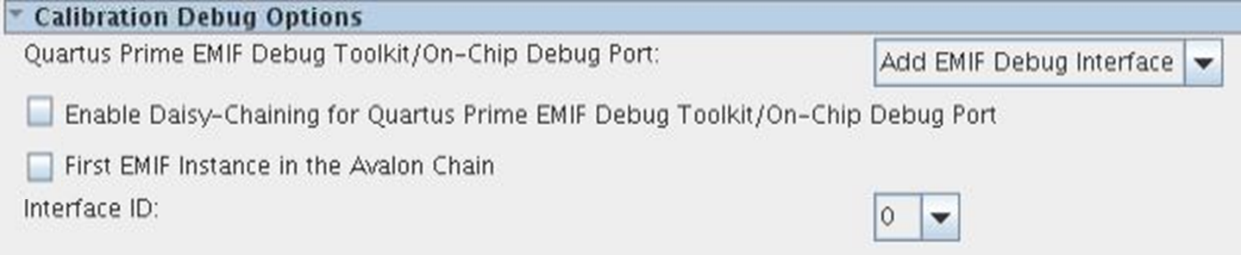
Connecting an EMIF IP Core and a PHYLite Core.
If you place any PHYLite cores with dynamic reconfiguration enabled into the same I/O column as an EMIF IP core, you should instantiate and connect the PHYLite cores in a similar way. See the Intel® FPGA PHYLite for Parallel Interfaces IP Core User Guide for more information.