Intel® Quartus® Prime Pro Edition User Guide: Design Optimization
A newer version of this document is available. Customers should click here to go to the newest version.
6.5.3.4. Report Register Spread
Registers that drive in opposite directions and connect to high fan-out can have placement-warping effects on the floorplan that impact fMAX. The placement-warping may not cause timing failures. Therefore, you can view this report to identify such registers. Taking steps to address the registers listed in the report can make placement of the design easier and improve fMAX performance.
You can automate duplication of registers with the DUPLICATE_REGISTER and DUPLICATE_HIERARCHY_DEPTH .qsf assignments, or you can manually modify RTL to duplicate registers or refactor logic. Refer to "Automatic Register Duplication: Hierarchical Proximity" in Intel Quartus Prime Pro Edition User Guide: Design Optimization.
You can specify various options to customize the report.
| Option | Available Settings |
|---|---|
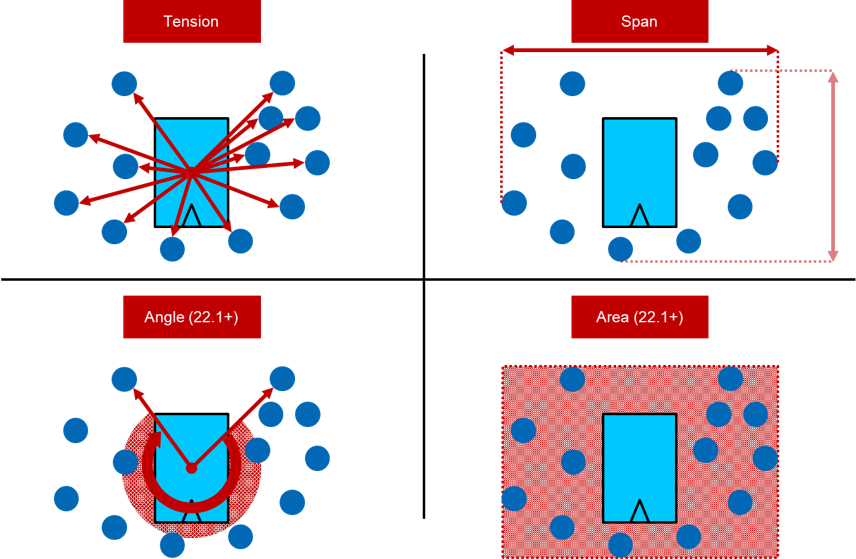
| Spread Type | Specifies the type of spread data in the report:
|
| Sink Type | Specifies the type of sink in the report:
|
| From Clock | Filters paths in the report to show only the launching clocks you specify. |
| To Clock | Filters paths in the report to show only the latching clocks you specify, allowing you to debug one clock at a time. |
| Report number of registers | Specifies the number of registers to display in the report. The default value for Report number of registers is 10. |
| Report panel name | Specifies the name of the report panel. You can optionally enable File name to write the information to a file. If you append .htm or .html as a suffix, the Timing Analyzer produces the report as HTML. If you enable File name, you can Overwrite or Append the file with latest data. |
| Tcl command | Displays the Tcl syntax that corresponds with the GUI options you select. You can copy the command from the Console into a Tcl file. |