Intel® Quartus® Prime Pro Edition User Guide: Design Optimization
ID
683641
Date
9/26/2022
Public
A newer version of this document is available. Customers should click here to go to the newest version.
1. Answers to Top FAQs
2. Design Optimization Overview
3. Optimizing the Design Netlist
4. Netlist Optimizations and Physical Synthesis
5. Area Optimization
6. Timing Closure and Optimization
7. Analyzing and Optimizing the Design Floorplan
8. Using the ECO Compilation Flow
9. Intel® Quartus® Prime Pro Edition Design Optimization User Guide Archives
A. Intel® Quartus® Prime Pro Edition User Guides
3.1. When to Use the Netlist Viewers: Analyzing Design Problems
3.2. Intel® Quartus® Prime Design Flow with the Netlist Viewers
3.3. RTL Viewer Overview
3.4. Technology Map Viewer Overview
3.5. Netlist Viewer User Interface
3.6. Schematic View
3.7. Cross-Probing to a Source Design File and Other Intel® Quartus® Prime Windows
3.8. Cross-Probing to the Netlist Viewers from Other Intel® Quartus® Prime Windows
3.9. Viewing a Timing Path
3.10. Optimizing the Design Netlist Revision History
3.6.1. Display Schematics in Multiple Tabbed View
3.6.2. Schematic Symbols
3.6.3. Select Items in the Schematic View
3.6.4. Shortcut Menu Commands in the Schematic View
3.6.5. Filtering in the Schematic View
3.6.6. View Contents of Nodes in the Schematic View
3.6.7. Moving Nodes in the Schematic View
3.6.8. View LUT Representations in the Technology Map Viewer
3.6.9. Zoom Controls
3.6.10. Navigating with the Bird's Eye View
3.6.11. Partition the Schematic into Pages
3.6.12. Follow Nets Across Schematic Pages
5.2.3.1. Guideline: Optimize Source Code
5.2.3.2. Guideline: Optimize Synthesis for Area, Not Speed
5.2.3.3. Guideline: Restructure Multiplexers
5.2.3.4. Guideline: Perform WYSIWYG Primitive Resynthesis with Balanced or Area Setting
5.2.3.5. Guideline: Use Register Packing
5.2.3.6. Guideline: Remove Fitter Constraints
5.2.3.7. Guideline: Flatten the Hierarchy During Synthesis
5.2.3.8. Guideline: Re-target Memory Blocks
5.2.3.9. Guideline: Use Physical Synthesis Options to Reduce Area
5.2.3.10. Guideline: Retarget or Balance DSP Blocks
5.2.3.11. Guideline: Use a Larger Device
5.2.3.12. Guideline: Reduce Global Signal Congestion
5.2.3.13. Guideline: Report Pipelining Information
5.2.4.1. Guideline: Set Auto Packed Registers to Sparse or Sparse Auto
5.2.4.2. Guideline: Set Fitter Aggressive Routability Optimizations to Always
5.2.4.3. Guideline: Increase Router Effort Multiplier
5.2.4.4. Guideline: Remove Fitter Constraints
5.2.4.5. Guideline: Optimize Synthesis for Routability
5.2.4.6. Guideline: Optimize Source Code
5.2.4.7. Guideline: Use a Larger Device
6.1. Optimize Multi Corner Timing
6.2. Optimize Critical Paths
6.3. Optimize Critical Chains
6.4. Design Evaluation for Timing Closure
6.5. Timing Optimization
6.6. Periphery to Core Register Placement and Routing Optimization
6.7. Scripting Support
6.8. Timing Closure and Optimization Revision History
6.5.1. Correct Design Assistant Rule Violations
6.5.2. Implement Fast Forward Timing Closure Recommendations
6.5.3. Review Timing Path Details
6.5.4. Try Optional Fitter Settings
6.5.5. Back-Annotate Optimized Assignments
6.5.6. Optimize Settings with Design Space Explorer II
6.5.7. I/O Timing Optimization Techniques
6.5.8. Register-to-Register Timing Optimization Techniques
6.5.9. Metastability Analysis and Optimization Techniques
6.5.3.1. Report Timing
6.5.3.2. Report Logic Depth
6.5.3.3. Report Neighbor Paths
6.5.3.4. Report Register Spread
6.5.3.5. Report Route Net of Interest
6.5.3.6. Report Retiming Restrictions
6.5.3.7. Report Pipelining Information
6.5.3.8. Report CDC Viewer
6.5.3.9. Timing Closure Recommendations
6.5.3.10. Global Network Buffers
6.5.3.11. Resets and Global Networks
6.5.3.12. Suspicious Setup
6.5.3.13. Auto Shift Register Replacement
6.5.3.14. Clocking Architecture
6.5.7.1. I/O Timing Constraints
6.5.7.2. Optimize IOC Register Placement for Timing Logic Option
6.5.7.3. Fast Input, Output, and Output Enable Registers
6.5.7.4. Programmable Delays
6.5.7.5. Use PLLs to Shift Clock Edges
6.5.7.6. Use Fast Regional Clock Networks and Regional Clocks Networks
6.5.7.7. Spine Clock Limitations
6.5.8.1. Optimize Source Code
6.5.8.2. Improving Register-to-Register Timing
6.5.8.3. Physical Synthesis Optimizations
6.5.8.4. Set Power Optimization During Synthesis to Normal Compilation
6.5.8.5. Optimize Synthesis for Performance, Not Area
6.5.8.6. Flatten the Hierarchy During Synthesis
6.5.8.7. Set the Synthesis Effort to High
6.5.8.8. Duplicate Registers for Fan-Out Control
6.5.8.9. Prevent Shift Register Inference
6.5.8.10. Use Other Synthesis Options Available in Your Synthesis Tool
6.5.8.11. Fitter Seed
6.5.8.12. Set Maximum Router Timing Optimization Level
6.5.8.13. Register-to-Register Timing Analysis
6.5.8.13.1. Tips for Analyzing Failing Paths
6.5.8.13.2. Tips for Analyzing Failing Clock Paths that Cross Clock Domains
6.5.8.13.3. Tips for Critical Path Analysis
6.5.8.13.4. Tips for Creating a .tcl Script to Monitor Critical Paths Across Compiles
6.5.8.13.5. Global Routing Resources
6.5.8.13.6. Register RAMS and DSPs
7.1. Design Floorplan Analysis in Chip Planner
7.2. Defining Logic Lock Placement Constraints
7.3. Defining Virtual Pins
7.4. Using Logic Lock Regions in Combination with Design Partitions
7.5. Creating Clock Region Assignments in Chip Planner
7.6. Scripting Support
7.7. Analyzing and Optimizing the Design Floorplan Revision History
7.1.1. Starting the Chip Planner
7.1.2. Chip Planner GUI
7.1.3. Viewing Design Elements in Chip Planner
7.1.4. Finding Design Elements in the Chip Planner
7.1.5. Exploring Paths in the Chip Planner
7.1.6. Viewing Assignments in the Chip Planner
7.1.7. Viewing High-Speed and Low-Power Tiles in the Chip Planner
7.1.8. Viewing Design Partition Placement
7.1.3.1. Viewing Architecture-Specific Design Information in Chip Planner
7.1.3.2. Viewing Available Clock Networks in Chip Planner
7.1.3.3. Viewing Clock Sector Utilization in Chip Planner
7.1.3.4. Viewing Routing Congestion in Chip Planner
7.1.3.5. Viewing I/O Banks in Chip Planner
7.1.3.6. Viewing High-Speed Serial Interfaces (HSSI) in Chip Planner
7.1.3.7. Viewing Source and Destination Nodes in Chip Planner
7.1.3.8. Viewing Fan-In and Fan-Out in Chip Planner
7.1.3.9. Viewing Immediate Fan-In and Fan-Out in Chip Planner
7.1.3.10. Viewing the Selected Contents in Chip Planner
7.1.3.11. Viewing the Location and Utilization of Device Resources in Chip Planner
7.1.3.12. Viewing Module Placement by Cross-Probing to Chip Planner
7.2.1. The Logic Lock Regions Window
7.2.2. Defining Logic Lock Regions
7.2.3. Customizing the Shape of Logic Lock Regions
7.2.4. Assigning Device Pins to Logic Lock Regions
7.2.5. Viewing Connections Between Logic Lock Regions in Chip Planner
7.2.6. Example: Placement Best Practices for Intel® Arria® 10 FPGAs
7.2.7. Migrating Assignments between Intel® Quartus® Prime Standard Edition and Intel® Quartus® Prime Pro Edition
8.4.1. ECO Command Quick Reference
8.4.2. make_connection
8.4.3. remove_connection
8.4.4. modify_lutmask
8.4.5. adjust_pll_refclk
8.4.6. modify_io_slew_rate
8.4.7. modify_io_current_strength
8.4.8. modify_io_delay_chain
8.4.9. create_new_node
8.4.10. remove_node
8.4.11. place_node
8.4.12. unplace_node
8.4.13. create_wirelut
6.5.3.2. Report Logic Depth
The Timing Analyzer's Reports > Design Metrics > Report Logic Depth... command allows you to report the number of logic levels within a clock domain. This value typically corresponds to the number of look-up tables (LUTs) that a path passes through.
The equivalent scripting command is report_design_metrics -logic_depth. Report Logic Depth shows the distribution of logic depth among the critical paths, allowing you to identify areas where you can reduce logic levels in your RTL.
Figure 35. Report Logic Depth (Histogram)
Figure 36. Report Paths of Depth 3Call report logic depth by topology for each clock, intraclock only.
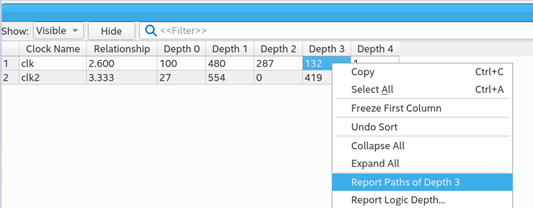
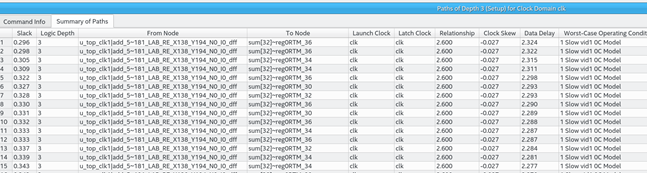
Figure 37. Summary of PathsClose timing with accurate histogram cross probing.
You can specify various options to customize the reporting.
| Option | Description |
|---|---|
| Clocks | From Clock and To Clock filter paths in the report to show only the launching or latching clocks you specify. |
| Targets | Specifies the target node for From Clock and To Clock to report logic depth with only those endpoints. Specify an I/O or register name or I/O port for this option. The field also supports wildcard characters. When the From, To, or Through boxes are empty, the Timing Analyzer assumes all possible targets in the device. The Through option limits the report for paths that pass through combinatorial logic, or a particular pin on a cell. |
| Analysis type | The Setup, Hold, Recovery, and Removal analyses report the logic depths of the top X paths by slack. Topology analysis reports the logic depths of the top X paths by logic depth. |
| Paths | Specifies the number of paths to display by endpoint and slack level. The default value for Report number of paths is 10, otherwise, the report can be very long. Enable Pairs only to list only one path for each pair of source and destination. Limit further with Maximum number of paths per endpoints. You can also filter paths by entering a value in the Maximum slack limit field. |
| Detail | Specify whether to display on Histogram or full Path level of detail. |
| Report panel name | Specifies the name of the report panel. You can optionally enable File name to write the information to a file. If you append .htm or .html as a suffix, the Timing Analyzer produces the report as HTML. If you enable File name, you can Overwrite or Append the file with latest data. |
| Tcl command | Displays the Tcl syntax that corresponds with the GUI options you select. You can copy the command from the Console into a Tcl file. |