F-Tile Avalon® Streaming Intel® FPGA IP for PCI Express* User Guide
A newer version of this document is available. Customers should click here to go to the newest version.
8.2.3. Launching the F-Tile Debug Toolkit
Use the design example you compiled by following the Quick Start Guide to familiarize yourself with the F-Tile Debug Toolkit. Follow the steps in the Generating the Design Example and Compiling the Design Example to generate the SRAM Object File, (.sof) for this design example.
To use the F-Tile Debug Toolkit, download the .sof to the Intel Development Kit. Then, open the System Console and load the design to the System Console as well. Loading the .sof to the System Console allows the System Console to communicate with the design using NPDME. NPDME is a JTAG-based Avalon-MM master. It drives Avalon-MM slave interfaces in the PCIe design. When using NPDME, the Intel® Quartus® Prime software inserts the debug interconnect fabric to connect with JTAG.
- Use the Intel® Quartus® Prime Programmer to download the .sof to the Intel FPGA Development Kit.
Note: To ensure correct operation, use the same version of the Intel® Quartus® Prime Programmer and Intel® Quartus® Prime Pro Edition software that you used to generate the .sof.
- To load the design into System Console:
- Launch the Intel® Quartus® Prime Pro Edition software.
- Start System Console by choosing Tools, then System Debugging Tools, then System Console.
- On the System Console File menu, select Load design and browse to the .sof file.
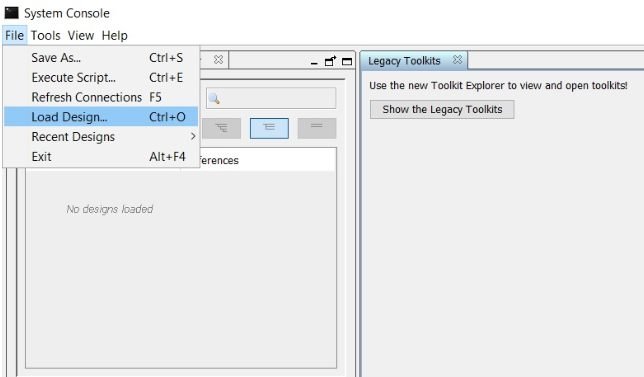
- Select the .sof and click OK. The .sof loads to the System Console.
- The System Console Toolkit Explorer window will list all the DUTs in the design that have the F-Tile Debug Toolkit enabled.
- Select the DUT with the F-Tile Debug Toolkit you want to view. This will open the Debug Toolkit instance of that DUT in the Details window.
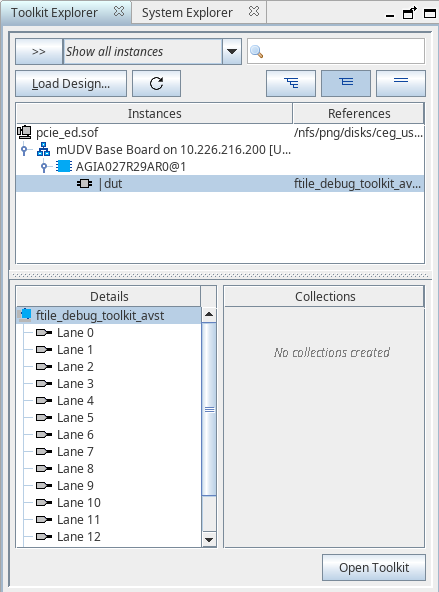
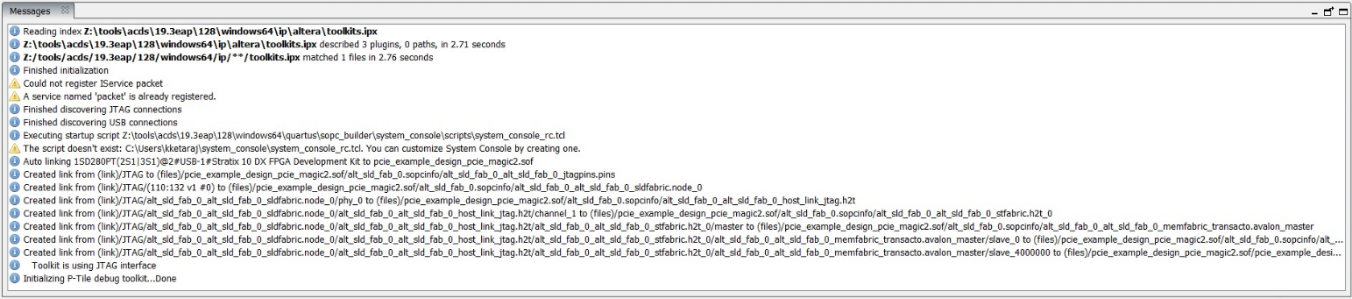
- Click on the ftile_debug_toolkit_avst to open that instance of the Toolkit. Once the Debug Toolkit is initialized and loaded, you will see the following message in the Messages window: “Initializing F-Tile debug toolkit – done”.
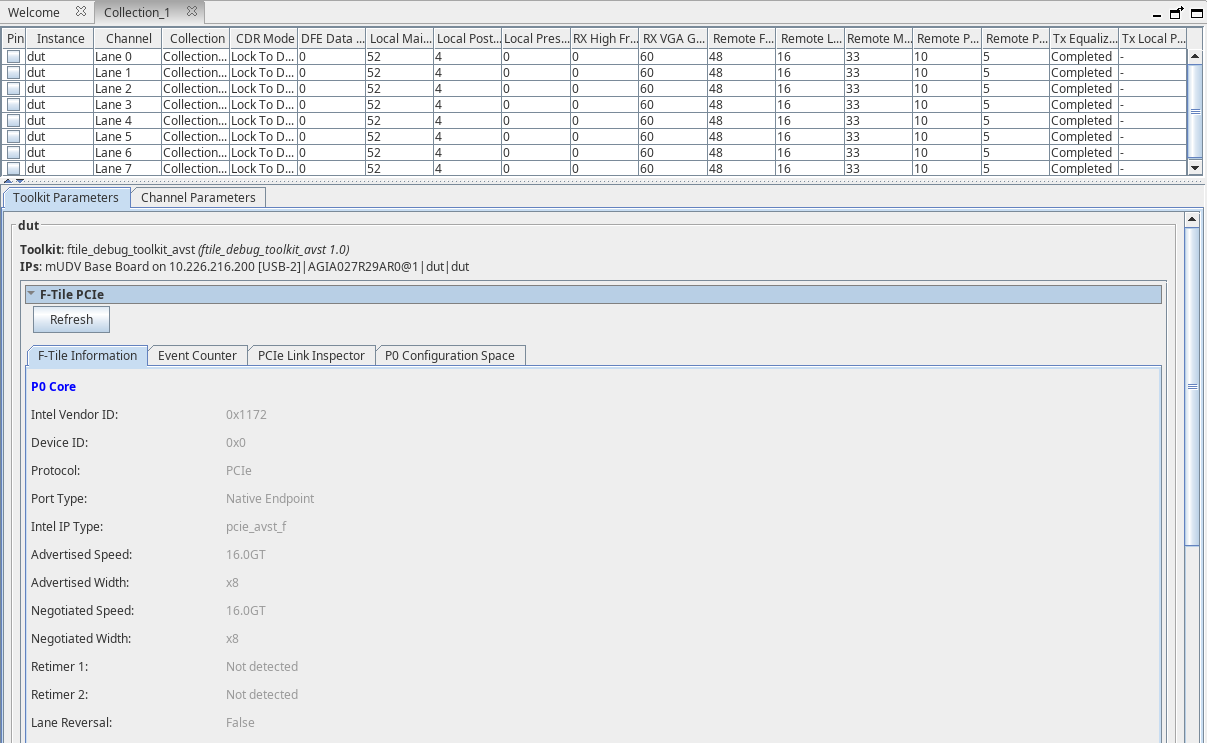
- A new window Main view will open with a view of all the channels in that instance.
- Select the DUT with the F-Tile Debug Toolkit you want to view. This will open the Debug Toolkit instance of that DUT in the Details window.