Intel® FPGA SDK for OpenCL™ Pro Edition: Best Practices Guide
2.1. High-Level Design Report Layout
Reports Menu
The Reports menu provides three hierarchical categories of views. You can select a report to view an analysis of different parts of your kernel design. All reports are interlinked.
- Summary gives you a quick overview of the results of compiling your design including a summary of all kernels in your design along with an estimate of resources used by the kernels. To navigate to a particular section of the summary report, use the left-hand list pane, which you can show or hide by selecting the List button on the top-right corner.
- Bottlenecks gives a quick overview of the throughput bottlenecks in the design. You can show or hide the Bottlenecks viewers by selecting the List button on the top-right corner.
- Throughput Analysis helps you in optimizing your design based on fMAX and bottleneck summary, result from Intel® FPGA dynamic profiler for OpenCL™ , loop analysis, and latency estimator.
- Area Analysis helps you in locating the area inefficiency. It provides information about resource utilization of the system, incremental compile, Intel Quartus resource summary, and wasted RAM bits.
- System Viewers provide a graphical representation of the generated hardware to supplement the throughput and area analysis. Each viewer shows different information about kernels, channels, global memory, blocks, clusters, and more.
Analysis Pane
The analysis pane displays detailed information of the report you selected from the reports menu.
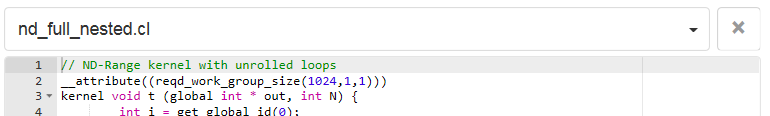
Source Code Pane
The source code pane displays the code for all the source files in your kernel .
To select between different source files in your kernel , click the pull-down menu at the top of the source code pane. To collapse the source code pane, do one of the following actions:
- Click the X icon beside the source code pane pull-down menu.
- Select the Source Code button on the top-right corner of the report to show or hide the source code pane.
The source code is displayed when you have not specified the -g0 compiler command option when you compiled your code.
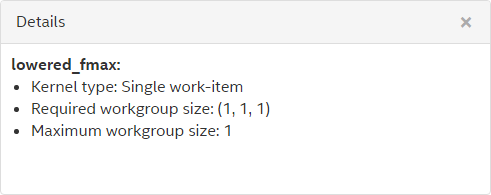
Details Pane
For each line that appears in a loop analysis or area report, the Details pane shows additional information, if available, that elaborates on the comment in the Details column report. To collapse the Details pane, do one of the following actions:
- Click the X icon on the top-right corner side of the Details pane.
- Select the Details button on the top-right corner of the report to show or hide the Details pane.