1. Getting Started
2. Development Kit Overview
3. Power Up the Development Kit
4. Board Test System (BTS)
5. Development Kit Hardware and Configuration
6. Document Revision History for Intel® Stratix® 10 DX FPGA Development Kit User Guide
A. Development Kit Components
B. Safety and Regulatory Information
C. Compliance and Conformity Information
A.1. Components Overview
A.2. Power, Thermal, and Mechanical Considerations
A.3. Clock Circuits
A.4. Memory Interface
A.5. PCIe Interface
A.6. UPI Interface
A.7. Transceiver Signals: PCIe and UPI Interface
A.8. SlimSAS Connector
A.9. QSFP Network Interface
A.10. I2C Interface
A.11. QSPI Flash Memory
4.3.4. QSFP Tab
This tab allows you to perform loopback tests on the QSFP ports.
Figure 10. QSFP Tab
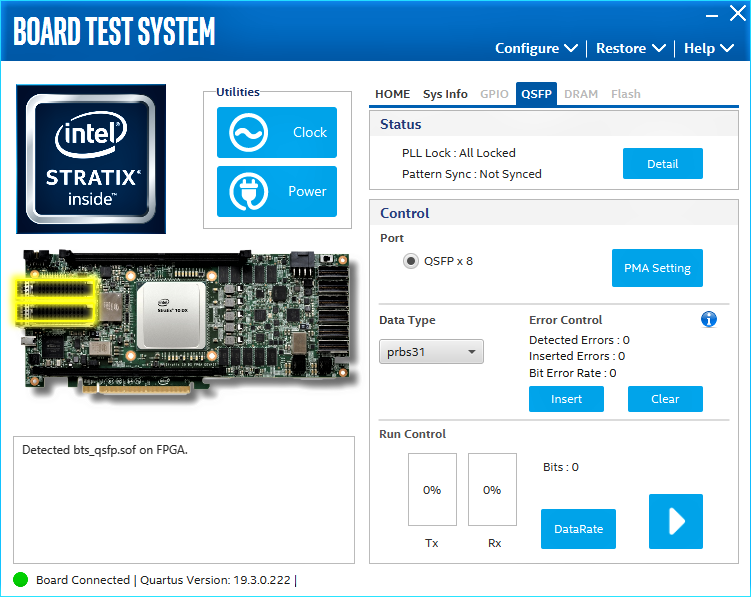
The following sections describe the controls on the QSFP tab:
Status
Displays the following status information during a loopback test:
- PLL Lock: Shows the PLL locked or unlocked state.
- Pattern sync: Shows the pattern synced or not synced state. The pattern is considered synced when the start of the data sequence is detected.
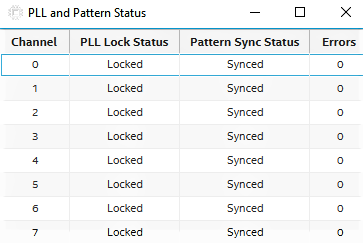
- Details: Shows the PLL lock and pattern sync status:
Figure 11. PLL and Pattern Status
Port
Allows you to specify which interface to test. The following port tests are available:
- QSFP x8
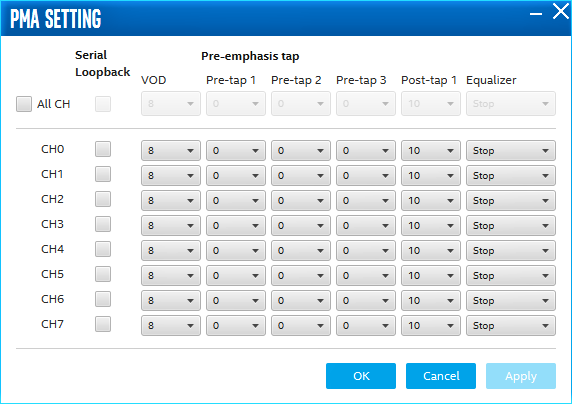
PMA Setting
Allows you to make changes to the PMA parameters that affect the active transceiver interface. The following settings are available for analysis:
- Serial Loopback: Routes signals between the transmitter and the receiver.
- VOD: Specifies the voltage output differential of the transmitter buffer.
- Pre-emphasis tap:
- Pre-tap 1: Specifies the amount of pre-emphasis on the first pre-tap of the transmitter buffer.
- Pre-tap 2: Specifies the amount of pre-emphasis on the second pre-tap of the transmitter buffer.
- Pre-tap 3: Specifies the amount of pre-emphasis on the third pre-tap of the transmitter buffer.
- Post-tap 1: Specifies the amount of pre-emphasis on the post-tap of the transmitter buffer.
- Equalizer: Specifies the RX tuning mode for receiver equalizer.
Figure 12. PMA Setting
Data Type
Specifies the type of data contained in the transactions. The following data types are available for analysis:
- PRBS 7: Selects pseudo-random 7-bit sequences.
- PRBS 15: Selects pseudo-random 15-bit sequences.
- PRBS 23: Selects pseudo-random 23-bit sequences.
- PRBS 31: Selects pseudo-random 31-bit sequences.
- HF: Selects highest frequency divide-by-2 data pattern 10101010.
- LF: Selects lowest frequency divide-by-33 data pattern.
Error Control
Displays data errors detected during analysis and allows you to insert errors:
- Detected errors: Displays the number of data errors detected in the hardware.
- Inserted errors: Displays the number of errors inserted into the transmit data stream.
- Insert: Inserts a one-word error into the transmit data stream each time you click the button. Insert is only enabled during transaction performance analysis.
- Clear: Resets the detected errors and inserted errors counters to zero.
Loopback
- Start: Initiates the selected ports transaction performance analysis. Always click Clear before Start.
- Stop: Terminates transaction performance analysis.
- TX and RX performance bars: Show the percentage of maximum theoretical data rate that the requested transactions are able to achieve.