R-Tile Avalon® Streaming Intel® FPGA IP for PCI Express* User Guide
A newer version of this document is available. Customers should click here to go to the newest version.
6.6.1. Overview
The R-tile Debug Toolkit (DTK) is a System Console-based tool for R-tile that provides real-time control, monitoring and debugging of the PCIe links.
- Monitor the IP configuration and the link status.
- Monitor the PCIe Configuration space.
- Monitor different counters for errors and event conditions.
- Perform Time margin (horizontal) and Voltage margin (vertical) and compare margin values against recommended masks for each channel.
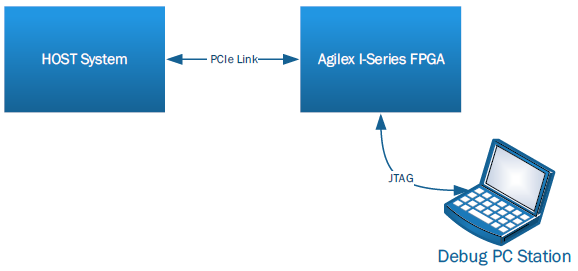
- Host: The link partner component connected to R-tile through a PCIe link.
- Intel Agilex® 7 I-Series FPGA: This component includes the R-tile PCIe IP under debug.
- Debug PC Station: An additional computer system with the Intel® Quartus® Prime Pro Edition software installed which is running the Debug Toolkit and is connected to the Intel Agilex® 7 I-Series FPGA through a JTAG connection.
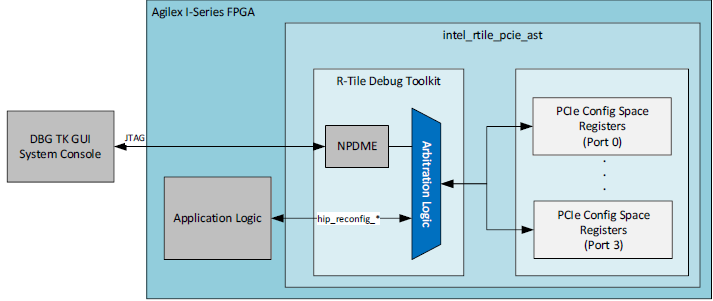
When you enable the R-tile Debug Toolkit, the intel_rtile_pcie_ast module of the generated IP includes the Debug Toolkit modules and related logic as shown in Debug Toolkit Arbitration.
The Debug PC Station that is running the System Console tool connects to the Debug Toolkit via a Native PHY Debug Master Endpoint (NPDME). This connection is made using JTAG through an Intel FPGA Download Cable.
When you enable the R-tile Debug Toolkit in the IP Parameter Editor, the Hard IP Reconfiguration Interface will be enabled. A multiplexer is implemented to allow a dynamic switching between the Application logic and the Debug Toolkit. The Application logic has the default access. Upon launching the Debug Toolkit in the System Console tool, the arbitration selection happens automatically. While the DTK is open in the System Console, Application logic will not be able to drive signals on the Hard IP Reconfiguration Interface. Once the Debug Toolkit window in the System Console is closed, the Application logic can once again drive the Hard IP Reconfiguration Interface.
To make sure there are no transactions in progress, the Debug Toolkit can be launched successfully only if there is no pending Read or Write transaction made by the Application logic on the Hard IP Reconfiguration Interface.