Intel® Quartus® Prime Pro Edition User Guide: Design Compilation
A newer version of this document is available. Customers should click here to go to the newest version.
2.3.1. Exploring the RTL Analyzer (Beta)
The RTL Analyzer GUI has the following major components:
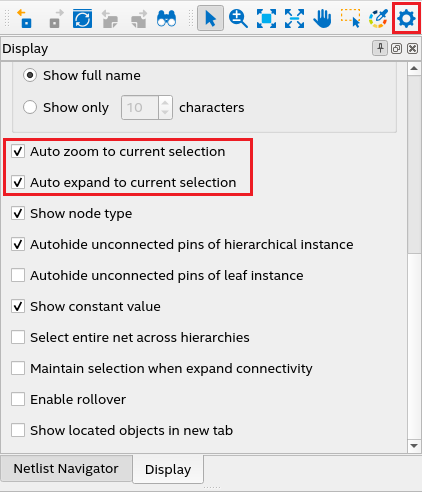
- Before exploring your design in the RTL Analyzer, select your desired viewing modes in the Display settings by navigating to View > Display Settings menu. The Auto zoom to current selection and Auto expand to current selection modes are enabled by default in the Display settings. You can disable one or both of these modes. In the enabled mode, the object you select in the hierarchy browser gets automatically highlighted in the schematic viewer. The schematic viewer and hierarchy browser expands the current selected object's hierarchy and adjusts the view to ensure the object is visible. Disable both modes if you do not want your current view to change in the hierarchy browser and schematic viewer.
- RTL Analyzer automatically saves the last view of your design when you close it. So, when you relaunch the RTL Analyzer, the last view is restored, and you can continue your work from where you left it previously. However, in the event you change your RTL design and recompile the project after exiting the RTL Analyzer, the saved view is invalidated and not restored.
Design Hierarchy Browser
The design hierarchy browser renders the design netlist five-box data model. The core elements of this data model are modules, instances, ports, instance ports, and nets. For more information about this data model, refer to Design Netlist Infrastructure (Beta).
Various GUI elements of the RTL analyzer are synchronized and respond to the objects within the Objects pane. For example, for the currently selected object in the hierarchy browser, the schematic viewer brings the object into focus with a highlight, the Tcl Console emits an equivalent Tcl command, and the Properties viewer provides relevant information about the object. You can cross-probe from selected objects in the netlist to the source where they were defined by right-clicking on an object and selecting Locate Node > Locate in Design File option in the context-sensitive menu. The source file displays in the Quartus main window showing the line that instantiates the object.
Schematic Viewer
The schematic viewer represents the design elements, such as modules, instances, ports, instance ports, and nets, schematically within the viewer. The viewer reacts and updates to bring different objects into focus as you navigate through the netlist.
Properties Viewer
The Property pane provides information about assignments and SDC constraints attached to the selected object in the hierarchy browser. You can cross-probe to the definition of the assignment in the source file.
Tcl Console
The Tcl Console provides a robust scripting interface that reports issues and displays relevant Tcl commands for GUI actions. It allows you to traverse and analyze your design. As you type the Tcl commands, notice how the schematic viewer and the hierarchy browser respond accordingly.
Object Finder
The object finder helps in locating an object in the design netlist. You can refine your search based on the object type (instance, instance bus, inst_port, port, port_bus, net, and net_bus) and modules. For complicated designs, you can further use filters to refine your search.
The RTL Analyzer provides the following tools and functionality: