Intel® Quartus® Prime Pro Edition User Guide: Design Compilation
A newer version of this document is available. Customers should click here to go to the newest version.
2.3.1.2. Connectivity Tracer
To access this tool, invoke the RTL Analyzer from the Elaborated checkpoint of the Analysis & Elaboration stage, navigate to the Tools menu, and select Connectivity Tracer. The Connectivity Tracer tool displays.
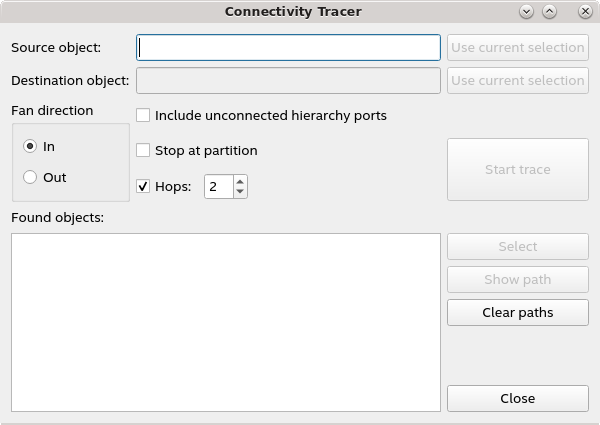
The following table describes various elements of the Connectivity Tracer interface:
| User Interface Element | Description |
|---|---|
| Source object | First object in the design hierarchy from where you want to start tracing the path. In this field, you can either enter the values manually or directly select the object from the schematic viewer and click the Use current selection button to enter the object automatically. |
| Destination object | An optional object where tracing stops when the Connectivity Tracer encounters this object. If you do not specify the destination object, then tracing is based on fan-ins or fan-outs of the source object. Similar to the source object, you can enter the destination object manually or automatically from the schematic viewer using the Use current selection button. |
| Fan direction (In or Out) | Refers to the maximum number of input or output nodes that feed the input or output equations of a logic cell, respectively. |
| Include unconnected hierarchy ports | Use this option if you want to include unconnected instance ports on hierarchical instances in the list of found objects. |
| Stop at partition | Use this option if you want to stop tracing on the design partition. |
| Hops | Indicates when tracing enter into and exit out of a hierarchical instance. Use this option to limit the number of hops allowed during tracing to improve performance. |
| Start trace | Use this button to start tracing your design's fan-in and fan-out connectivity based on the source and destination objects. |
| Found objects | Lists the traced objects.
|
Connectivity Tracer currently supports the following tracing techniques:
Point-to-point Tracing
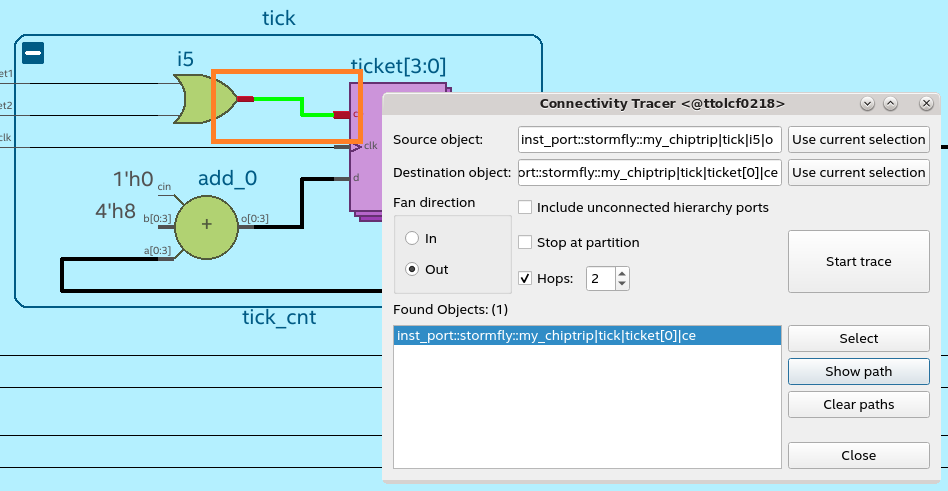
In this tracing technique, you select a source and destination object, set the fan direction as Out, and trace the path. All paths between the traced objects are listed under Found Objects. Select the desired path from the list and view it in the schematic viewer.
In the following image, the source object is the instance port i5 with a port name o, and the destination object is the instance port ticket[o] with a port name ce. When you trace this path, the Found Objects field lists only one path. When you view this path using Show path, the schematic viewer auto-highlights the path between the source and destination objects.
Fan-in Cone Tracing
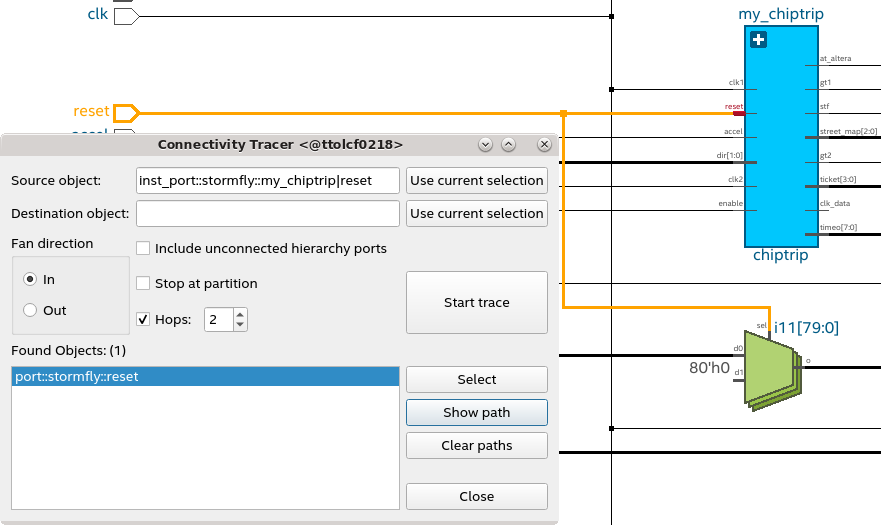
In this tracing technique, select only the source object, set the fan direction as In, and trace the path. The maximum number of input nodes that feed the input equations of a logic cell is traced and listed under Found Objects. Select the desired path from the list and view it in the schematic viewer.
In the following image, the source object is the instance port reset. When you trace the path, only one node is listed under Found Objects. When you view this path, you observe the first object reset of the instance port. The color-coded path is highlighted in the schematic viewer.
Fan-out Cone Tracing
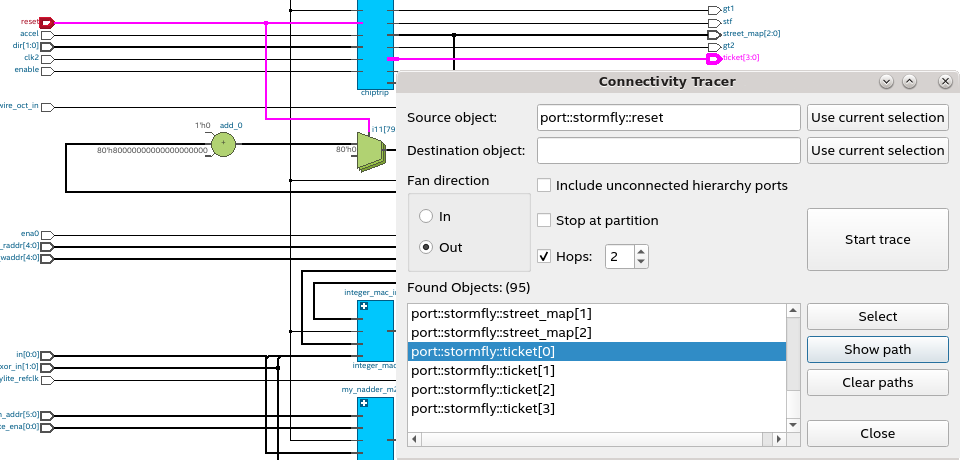
In this tracing technique, select only the source object, set the fan direction as Out, and trace the path. The Connectivity Tracer traces the maximum number of output nodes that feed the output equations of a logic cell and lists them under Found Objects. Select the desired path from the list and view it in the schematic viewer.
In the following image, the source object is the reset port. The Found Objects field lists several fan-out nodes when you trace the fan-out cone. When you select and view port::stormfly::adder_out[12], the path is highlighted in the schematic viewer showing the fan-out cone.
- After tracing several fan-in or fan-out nodes, the schematic viewer might have several paths highlighted. To review the color codes of the displayed nodes, use the Object Set Console window.
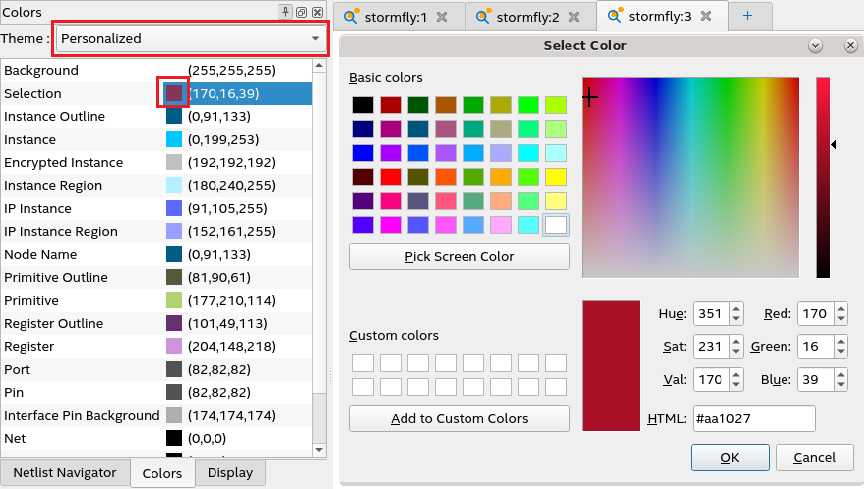
- When you select an object in the schematic viewer, the object is automatically color-coded based on the colors specified in the Colors pane. If you want to modify the colors or the schematic viewer background (white or black), go to Tools > Color Settings. In the Theme drop-down menu, you can switch between black and white background. To modify the object color, double-click on the respective color box. The Select Color dialog box displays. Select the desired color and click OK.