A newer version of this document is available. Customers should click here to go to the newest version.
Profiling Games built with Unity* (NEW)
Use this recipe to profile a game built with the Unity game engine. See how you can run Intel® VTune™ Profiler within the Unity environment to profile your game.
Often, the most important factor that affects the performance of a game is the frame rate. This is the speed with which the GPU renders game graphics. However, the CPU can also impact game performance in several ways:
- Slow transfer of data to the GPU
- Slow or unnecessary operations
- Poor parallelism
Content expert: Jennifer Dimatteo
Ingredients
Here are the hardware and software requirements for this performance recipe.
Application: Unity 2022.1.16. The sample game in this version of Unity uses the free asset 3D Game Kit.
Tools: Intel® VTune™ Profiler version 2022 - Hotspots Analysis (using User-Mode Sampling)
NOTE:Starting with the 2020 release, Intel® VTune™ Amplifier has been renamed to Intel® VTune™ Profiler.
Most recipes in the Intel® VTune™ Profiler Performance Analysis Cookbook are flexible. You can apply them to different versions of Intel® VTune™ Profiler. In some cases, minor adjustments may be required.
Get the latest version of Intel® VTune™ Profiler:
From the Intel® VTune™ Profiler product page.
Download the latest standalone package from the Intel® oneAPI standalone components page.
CPU/GPU: Intel® Core™ i7-8665U CPU @ 1.90GHz with integrated GPU
Operating system: Windows* 10 Enterprise
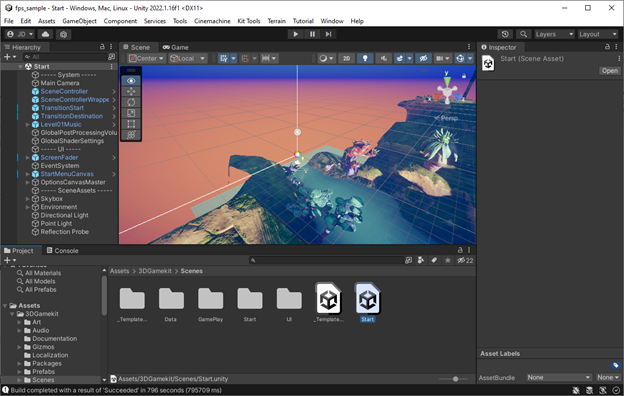
Build the Game in the Unity Editor
Open the game in the Unity editor.
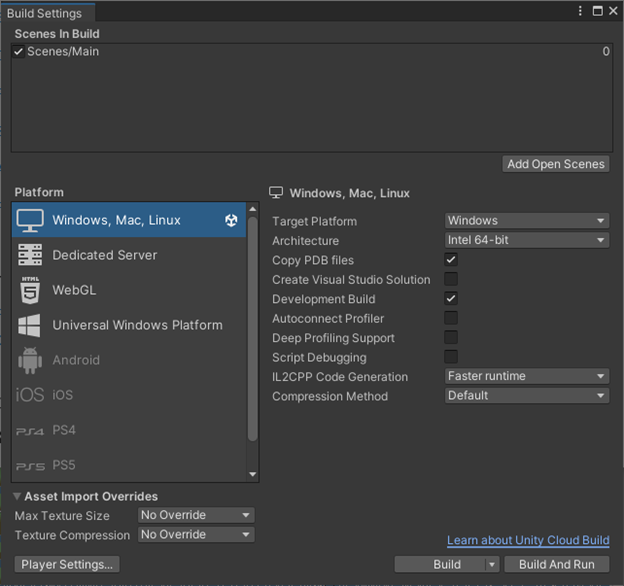
Build the game. Make sure to select the Copy PDB Files and Development Build options.
Configure Intel® VTune™ Profiler and Run Hotspots Analysis
Open Intel® VTune™ Profiler and click New Project on the Welcome screen.
Specify a project name and a location for your project.
- Click Create Project.
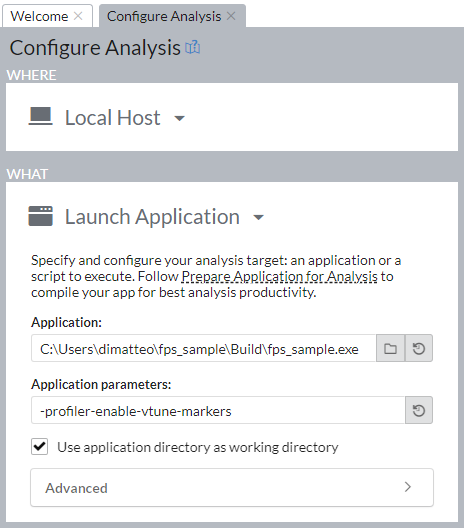
- In the Configure Analysis window, set these options:
In the WHERE pane, select Local Host.
In the Application field of the WHAT pane, enter the path to the game executable.
In the Application parameters field, enter -profiler-enable-vtune-markers.
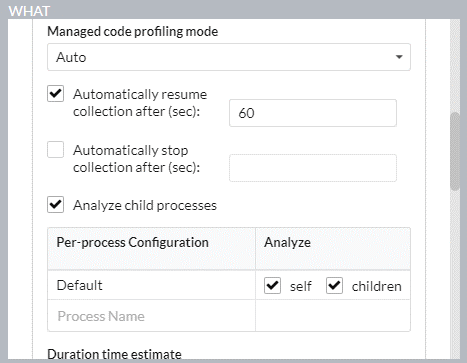
- (Optional) If you want to skip profiling the start/loading phase of the game,
- In the WHAT pane, open the Advanced section.
- Set Automatically resume collection after to the number of seconds that Intel® VTune™ Profiler should wait for profiling to begin.
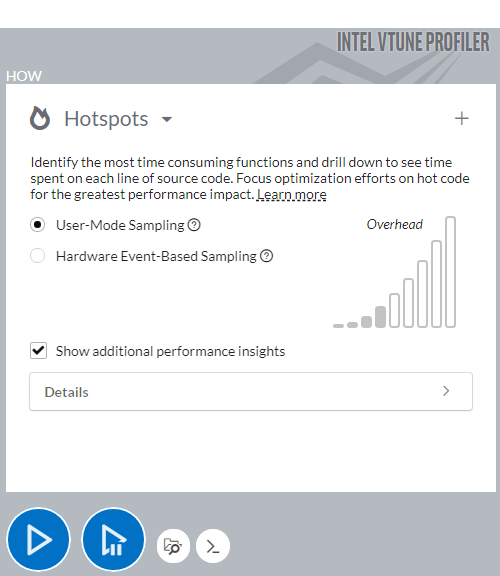
In the HOW pane, select the Hotspots analysis type and enable user-mode sampling.
Click Start to run the analysis.
 ) is available.
Review Results
After the data collection runs for about 30 seconds, click Stop to exit the game and finalize the VTune results. This process may take a few minutes as Intel® VTune™ Profiler finds and resolves debug symbols.
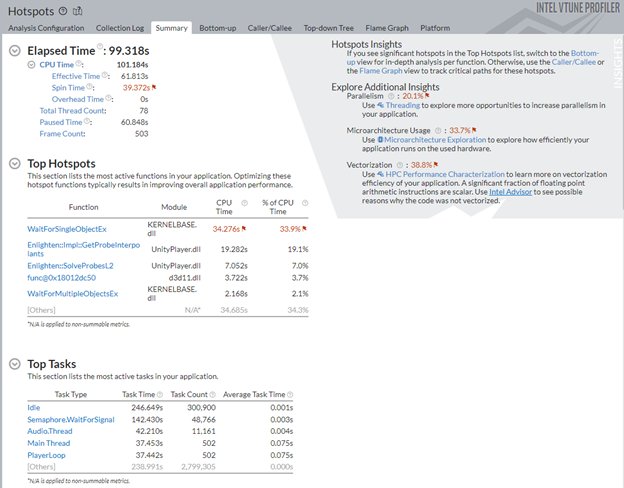
Once results have been finalized, the Summary tab displays information about:
- Elapsed time
- Top hotspots
- Top Unity tasks
- Additional insights and guidance
The Frame Rate Histogram shows the frequency at which frames executed during the collection.
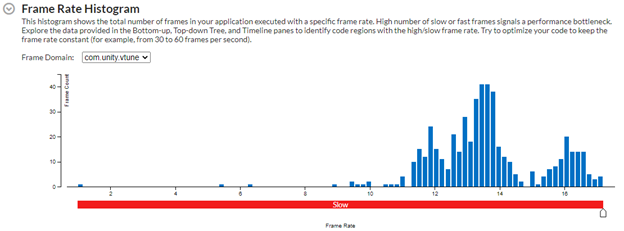
In this example, most frames executed between 13-14 frames per second (FPS). This is much slower than the recommended minimum of 30 FPS.
Switch to the Bottom-up window to see a list of functions. The default sorting is by descending order of CPU time.
Change the grouping from Function / Call Stack to Task Domain / Task Type / Function / Call Stack to focus on Unity tasks which were identified by the Intel® VTune™ Profiler Instrumentation and Tracing Technology API (ITT API).

The collection was started in a paused state, and this is indicated in the timeline view as Intel® VTune™ Profiler was still actively running.
Select the time period when collection starts at 60 seconds and zoom in.
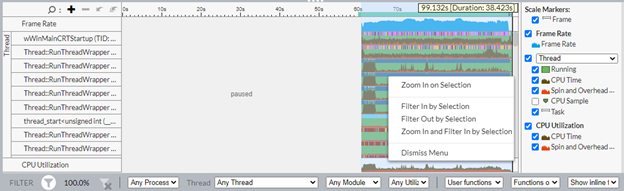
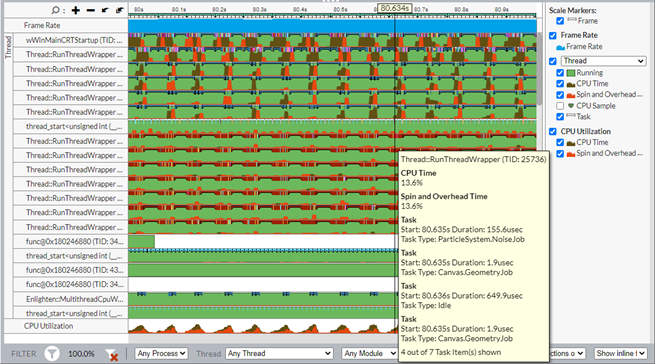
In this example, the frame rate is low and there is considerable spin time. In general, a game should not consume a high percentage of the CPU capacity of the system. If the worker threads have low parallelism, they may be adding too much overhead.
In one of the RunThreadWrapper threads, all of the CPU time is spin or overhead. Reducing the number of threads can improve performance here.
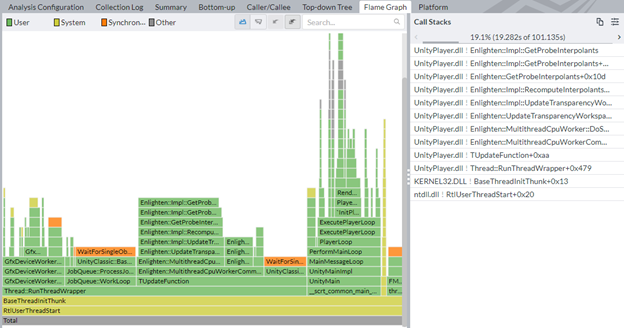
For additional insights into hotspots, open the Flame Graph view to see a graphical representation of call stacks from the top down.