PMDK Application Overhead
This recipe shows how to detect and fix an overhead on memory accesses for a PMDK-based application.
Content expert: Kirill Uhanov
Persistent Memory Development Kit (PMDK) provides support for transactional and atomic operations to keep the data consistent and durable. It is a collection of open source libraries and tools that are available today for both Linux* and Windows* OS. For more information, please visit pmem.io, the Persistent Memory Programming web site. PMDK facilitates persistent memory programming adoption with higher level language support. Currently, C and C++ support is fully validated and delivered on Linux, and available as early access on Windows.
The new generation of persistent memory from Intel has introduced a third memory tier. In addition to the memory and storage tiers, the persistent memory tier offers greater capacity than DRAM and significantly faster performance than storage. Applications can access persistent memory-resident data structures in-place, like they do with traditional memory, eliminating the need to page blocks of data back and forth between memory and storage.
However, taking an advantage of PMDK libraries may influence your application performance. Explore this recipe as an example how Intel® VTune™ Amplifier can help detect such issues.
Ingredients
This section lists the hardware and software tools used for the performance analysis scenario:
Application: a sample application that calculates the sum of two vector element-wise using PMDK memory allocators.
Compiler: GNU* compiler with the following compiler/linker options:
gcc -c -o array.o -O2 -g -fopenmp -I <pmdk-install-dir>/src/include -I <pmdk-install-dir>/src/examples array.c
gcc -o arrayBefore array.o -fopenmp -L <pmdk-install-dir>/src/nondebug -lpmemobj -lpmem -pthread
Performance analysis tools: Intel VTune Amplifier 2018: Memory Access / Advanced Hotspots analyses
NOTE:Starting with the 2020 release, Intel® VTune™ Amplifier has been renamed to Intel® VTune™ Profiler.
Most recipes in the Intel® VTune™ Profiler Performance Analysis Cookbook are flexible. You can apply them to different versions of Intel® VTune™ Profiler. In some cases, minor adjustments may be required.
Get the latest version of Intel® VTune™ Profiler:
From the Intel® VTune™ Profiler product page.
Download the latest standalone package from the Intel® oneAPI standalone components page.
Operating system: Ubuntu* 16.04 LTS
CPU: Intel® Core™ i7-6700K CPU @ 4.00GHz
Run Memory Access Analysis for Your PMDK App
This recipe starts with a sample application that utilizes the persistent memory. This application uses a triad kernel from a well-known stream benchmark and should fully utilize the DRAM bandwidth.
In this sample, the vector sum calculation is repeated in the loop to make compute work more significant and measurable for statistical analysis:
#include <ex_common.h>
#include <stdio.h>
#include <stdlib.h>
#include <sys/stat.h>
#include <libpmemobj.h>
#include <omp.h>

#define REPEATS 32


POBJ_LAYOUT_BEGIN(array);
POBJ_LAYOUT_TOID(array, int);
POBJ_LAYOUT_END(array);

int
main()
{
    size_t size = 82955000;
    size_t pool_size = 16200000000;
    int i,j;
    int multiplier = 3;

    PMEMobjpool *pop;
    char* path = "test_file1";
    if (file_exists(path) != 0)
    {
        if ((pop = pmemobj_create(path, POBJ_LAYOUT_NAME(array),
            pool_size, CREATE_MODE_RW)) == NULL)
        {
            printf("failed to create pool\n");
            return 1;
        }
    }
    else
    {
        if ((pop = pmemobj_open(path, POBJ_LAYOUT_NAME(array))) == NULL)
        {
            printf("failed to open pool\n");
            return 1;
        }
    }

    TOID(int) a;
    TOID(int) b;
    TOID(int) c;

    POBJ_ALLOC(pop, &a, int, sizeof(int) * size, NULL, NULL);
    POBJ_ALLOC(pop, &b, int, sizeof(int) * size, NULL, NULL);
    POBJ_ALLOC(pop, &c, int, sizeof(int) * size, NULL, NULL);

    for (i = 0; i < size; i++)
    {
        D_RW(a)[i] = (int)i;
        D_RW(b)[i] = (int)i+100;
        D_RW(c)[i] = (int)i+3;
    }

    pmemobj_persist(pop, D_RW(a), size * sizeof(*D_RW(a)));
    pmemobj_persist(pop, D_RW(b), size * sizeof(*D_RW(b)));
    pmemobj_persist(pop, D_RW(c), size * sizeof(*D_RW(c)));

    for (j = 0; j < REPEATS; j++)
    {
        #pragma omp parallel for
        for (i = 0; i < size; i++)
        {
            D_RW(c)[i] = multiplier * D_RO(a)[i] + D_RO(b)[i];
        }
    }

    POBJ_FREE(&a);
    POBJ_FREE(&b);
    POBJ_FREE(&c);

    pmemobj_close(pop);
    return 0;
}
To identify performance issues in the sample code and estimate the time spent on memory accesses, launch the VTune Amplifier and run the Memory Access analysis:
Click the New Project button on the toolbar and specify a name for the new project, for example: arraysum.
In the Analysis Target window, select the local host target system for the host-based analysis.
Select the Launch Application target type and specify an application for analysis on the right pane.
Click the Choose Analysis button on the right, select Microarchitecture Analysis > Memory Access on the left pane and click Start to run the analysis.
VTune Amplifier launches the application, collects data, finalizes the data collection result resolving symbol information, which is required for successful source analysis.
Identify Hotspots for the PMDK-based App
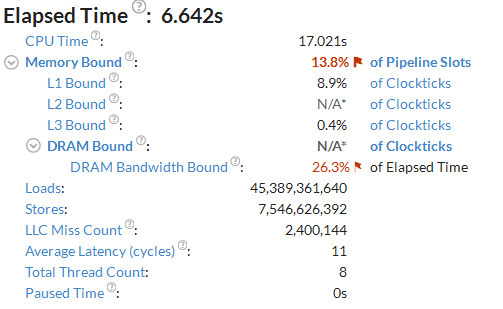
Start your analysis with the Summary view that provides application-level statistics per hardware metrics. Typically, the basic performance baseline is the application Elapsed time, which is equal to ~16 seconds for this sample code.
In spite of the expected high DRAM utilization for the PMDK code, the summary metrics do not define this sample app as DRAM bandwidth bound:

The Bandwidth Utilization Histogram also shows that the application underutilized the DRAM bandwidth with the Observed Maximum about 13 GB/sec, which is much less than expected:

Obviously, the PMDK has introduced some overhead into the code. For details, switch to Bottom-Up view and choose the Function / Call Stack grouping level:
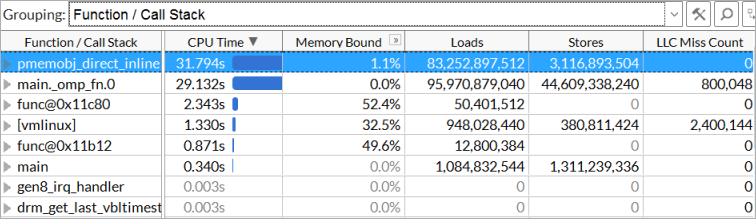
The largest hotspot is pmemobj_direct_inline. This is a function called inside D_RO and D_RW macros. Double-click the function to view the source code in <pmdk-install-dir>/src/include/libpmemobj/types.h:
#define DIRECT_RW(o) \
    (reinterpret_cast < __typeof__((o)._type) > (pmemobj_direct((o).oid)))
#define DIRECT_RO(o) \
    (reinterpret_cast < const __typeof__((o)._type) > \
    (pmemobj_direct((o).oid)))

#endif /* (defined(_MSC_VER) || defined(__cplusplus)) */

#define D_RW    DIRECT_RW
#define D_RO    DIRECT_RO
To better visualize the DRAM bandwidth utilization during the application run, explore the Platform view. DRAM Bandwidth shows up in green and blue.
Remove Redundant PMDK Function Calls
Since the memory for each array is allocated as one chunk, it is enough to call D_RO and D_RW only once before the calculation to get the array start addresses:
int* _c = D_RW(c);
const int* _a = D_RO(a);
const int* _b = D_RO(b);

for (j = 0; j < REPEATS; j++)
{
    #pragma omp parallel for
    for (i = 0; i < size; i++)
    {
      _c[i] = multiplier * _a[i] + _b[i];
    }
}
Re-compile the application and re-run the Memory Access analysis to see how this change affected the performance:
You see that the Elapsed time of the application has significantly reduced. PMDK overhead does not influence the performance.
The Bandwidth Utilization Histogram shows that the application fully utilizes DRAM bandwidth with the Observed Maximum about 25 GB/sec:

To discuss this recipe, visit the developer forum.