OS Thread Migration
This recipe provides steps to identify OS thread migration on the NUMA architecture with the Hotspots analysis in Intel® VTune™ Profiler.
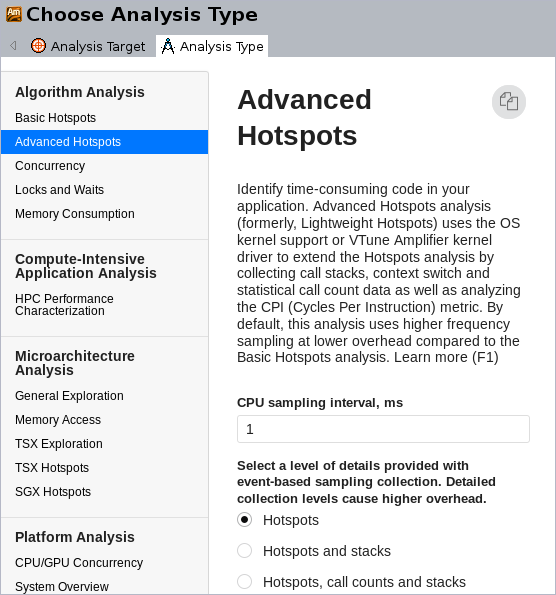
Advanced Hotspots analysis was integrated into the generic Hotspots analysis starting with Intel VTune Amplifier 2019, and is available via the Hardware Event-Based Sampling collection mode.
Complex operating systems use a scheduler to assign application threads, also known as software threads, to processor cores. The scheduler may choose the placement of the application threads on the physical cores depending on a number of different factors such as system state, system policies, and so on. A software thread may execute on a core for some period of time before being swapped out to wait. A software thread may have to wait for a number of reasons, such as being blocked for I/O. If available, another software thread may be given a chance to execute on this core. When the original software thread is once again available to execute, the scheduler may migrate the thread over to another core to ensure timely execution. This poses a problem to the newer computing architectures as this software thread migration disassociates the thread from data that has already been fetched into the caches resulting in longer data access latencies. This problem is further amplified in Non-Uniform Memory Access (NUMA) architectures, where each processor has its own local memory module that it can access directly with a distinct performance advantage. In a NUMA architecture, when a software thread is migrated to another core, the data stored in the earlier core's local memory becomes remote and memory access times increase significantly. Hence, thread migration can hurt performance making it important to identify if it is occurring in your application.
DIRECTIONS:
Ingredients
This section lists the hardware and software tools used for the performance analysis scenario.
Application: a test OpenMP* application. The application is used as a demo and not available for download.
Performance analysis tools:Intel® VTune™ Profiler version 2018 or newer - Hotspots analysis
NOTE:Starting with the 2020 release, Intel® VTune™ Amplifier has been renamed to Intel® VTune™ Profiler.
Most recipes in the Intel® VTune™ Profiler Performance Analysis Cookbook are flexible. You can apply them to different versions of Intel® VTune™ Profiler. In some cases, minor adjustments may be required.
Get the latest version of Intel® VTune™ Profiler:
From the Intel® VTune™ Profiler product page.
Download the latest standalone package from the Intel® oneAPI standalone components page.
Operating system: Linux*, Ubuntu* 16.04 64-bit
CPU: Intel® Core™ i7-6700K processor
Run Advanced Hotspots Analysis
Use Intel® VTune™ Profiler (GUI or amplxe-cl) to identify software thread migration in applications running on the Intel architecture. To identify OS thread migration, run Hotspots analysis (Basic or Advanced, for version 2018) on your application. For example, for Advanced Hotspots:
Identify Thread Migration
|
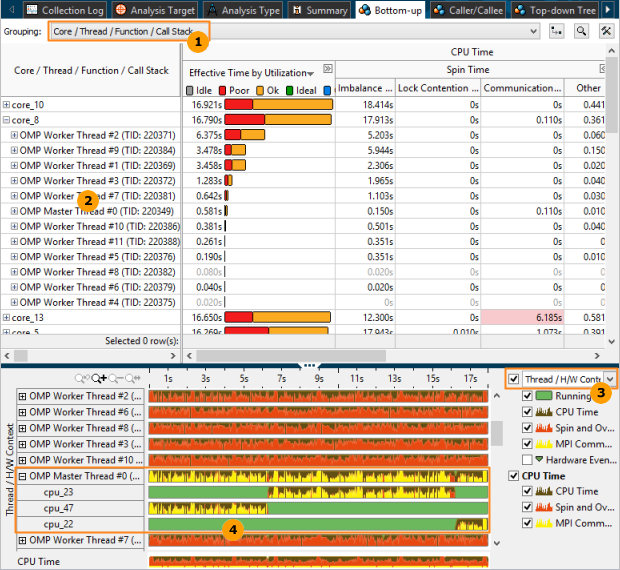
To identify thread migration using the GUI, select the Core/Thread/Function/Call Stack grouping. |
|
Expand core nodes to see the number of software threads. In general, you need the total number of threads to be less than or equal to the total number of hardware threads supported by the CPU. In addition to this, you need the threads to be equally distributed across the cores. If you see more than the expected number of software threads under any core in your result, there is a thread migration occurring in your application. In the above example, there are 12 OpenMP* worker threads instead of 2 threads (since this is an Intel® Xeon® processor supporting Intel® Hyper-Threading Technology), executing on core_8. This indicates thread migration. |
|
Select the Thread/H/W Context grouping to analyze thread migration the Timeline pane. |
|
Expand the thread nodes to see the number of CPUs where this thread was executed and analyze thread execution over time. In the example above, OpenMP thread #0 was executing on cpu_23 and then migrated to cpu_47. |


Alternately, you can view these results directly from the command line as follows:
amplxe-cl -group-by thread,cpuid -report hotspots -r /temp/test/omp -s "H/W Context" -q | less
Thread                  H/W Context  CPU Time:Self
------------------------------  -----------  -------------
OMP Worker Thread #5 (0x3d86)    cpu_0                0.004
matmul-intel64 (0x3d52)          cpu_1                0.013
OMP Worker Thread #15 (0x3d90)   cpu_10               2.418
matmul-intel64 (0x3d52)          cpu_10               2.023
OMP Worker Thread #8 (0x3d89)    cpu_10               0.687
OMP Worker Thread #13 (0x3d8e)   cpu_10               0.097
OMP Worker Thread #6 (0x3d87)    cpu_10               0.065
OMP Worker Thread #4 (0x3d85)    cpu_10               0.059
OMP Worker Thread #1 (0x3d82)    cpu_10               0.048
OMP Worker Thread #9 (0x3d8a)    cpu_10               0.034
OMP Worker Thread #11 (0x3d8c)   cpu_10               0.009
Similarly, you can notice the large number of OpenMP worker threads running on cpu_10.
Correct Thread Migration
You can correct the effects of thread migration by setting the thread affinity. Thread affinity refers to restricting the execution of certain threads to a subset of the physical processing units in a multiprocessor computer. Intel® runtime library has the ability to bind OpenMP threads to physical processing units. You can also use the OMP_PROC_BIND and OMP_PLACES, or Intel runtime specific KMP_AFFINITY environment variables to set the thread affinity for your OpenMP application.