Profiling Java Applications as a Remote User (NEW)
Use a wrapper script with Intel® VTune™ Profiler to profile Java applications as a remote user.
Normally, if you want to use VTune Profiler to profile a Java process that is in execution, you run a hardware-based sampling analysis and selecting Attach to Process as the target type. In Linux* environments, VTune Profiler uses the Linux perf tool to collect sampling data. For this purpose, you must run VTune Profiler as the same user who is running the Java process. This is because, if you run the Java process as a another user (even as root), the collector cannot attach to the Java process. However, in many cases, there is an arbitrary account that runs these applications, thus making it challenging to run them as a remote user.
In this recipe, we will see how you can use a wrapper script to run VTune Profiler and profile Java applications as a remote user.
Content expert: Jennifer Dimatteo
Ingredients
Here are the hardware and software tools you need for this recipe.
Application: Pi. This Java application is used as a demo and is not available for download. The application uses a Monte Carlo algorithm to estimate the value of Pi with multiple threads.
Analysis Tool: VTune Profiler version 2022 or newer - Hotspots Analysis using Hardware Event-Based Sampling (with Collect Stacks enabled)
NOTE:Starting with the 2020 release, Intel® VTune™ Amplifier has been renamed to Intel® VTune™ Profiler.
Most recipes in the Intel® VTune™ Profiler Performance Analysis Cookbook are flexible. You can apply them to different versions of Intel® VTune™ Profiler. In some cases, minor adjustments may be required.
Get the latest version of Intel® VTune™ Profiler:
From the Intel® VTune™ Profiler product page.
Download the latest standalone package from the Intel® oneAPI standalone components page.
Java Development Kit (JDK) version: OpenJDK 11.0.8 or newer
Local Operating System: Windows* 10 Enterprise
Remote Operating System/Amazon Machine Image (AMI): Ubuntu Server 20.04 LTS (HVM)
Remote CPU/Instance Type: AWS EC2 c5.9xlarge (Intel® microarchitecture code named Skylake with 36 logical CPUs)
Create the Java Application on the Remote Target
Prerequisite: Ensure that you have installed the JDK.
Create the Java file. In this example, we add an infinite loop around the body of main (while(true)) to simulate a long-running process:
*Pi.java*
Compile the Java file with symbols:
$ javac -g Pi.java
Run the Java Application as a Remote User
Start the Java application as a user other than the SSH user. In this example, the default user for the AWS instance is Ubuntu, so we create a new user (named intel) to run the application.
$ sudo adduser intel
$ su intel
$ java -Xcomp -Djava.library.path=native_lib/ia32 -cp ./ Pi
Verify that user intel is running the java process. Also note the ID of the process:
$ top

Configure VTune Profiler on the Local Machine for Remote Collection
Open the VTune Profiler GUI on your local machine.
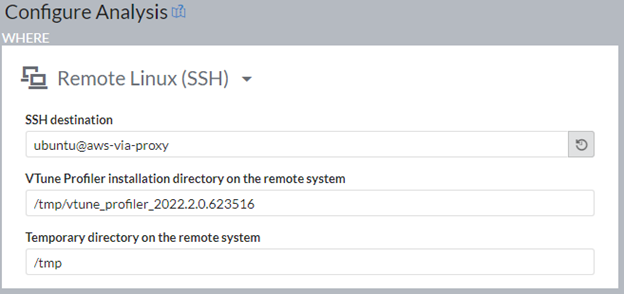
In the WHERE pane, select Remote Linux (SSH).
Configure the SSH destination for the target system with a user different from the one running the Java application. In this example, the SSH user is Ubuntu.
Deploy the VTune Profiler target package.
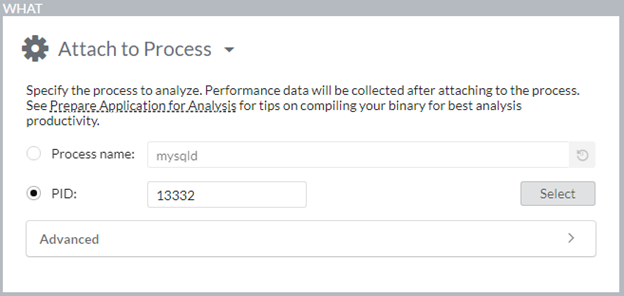
In the WHAT pane, select Attach to Process.
Enter the process ID for the Java application.
Create the Wrapper Script to Run VTune Collector
Use a text editor to create a file named vtune_wrapper.sh.
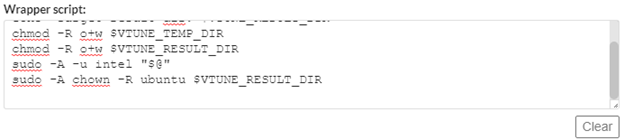
Populate the wrapper file with this text:
#!/bin/bash
echo "Target result dir: $VTUNE_RESULT_DIR"
chmod -R o+w $VTUNE_TEMP_DIR
chmod -R o+w $VTUNE_RESULT_DIR
sudo -A -u intel "$@"
sudo -A chown -R ubuntu $VTUNE_RESULT_DIR
In the WHAT pane, under the Advanced section, scroll to the Wrapper script text box.
Select vtune_wrapper.sh.
In the text box, place the cursor at the end of the last line and hit Enter to add a line feed. This helps to ensure that the script is recognized by the collection.
In the Advanced section, scroll up and locate the option marked Automatically stop collection after (sec). Enable this option and set a value of 30 to stop the collection after 30 seconds.
Run Hotspots Analysis with Hardware Event-Based Sampling and Stack Collection
In the HOW pane, select Hotspots analysis type in the Algorithm group.
Enable Hardware Event-Based Sampling.
Enable the Collect stacks option and set the Stack size to 4096.
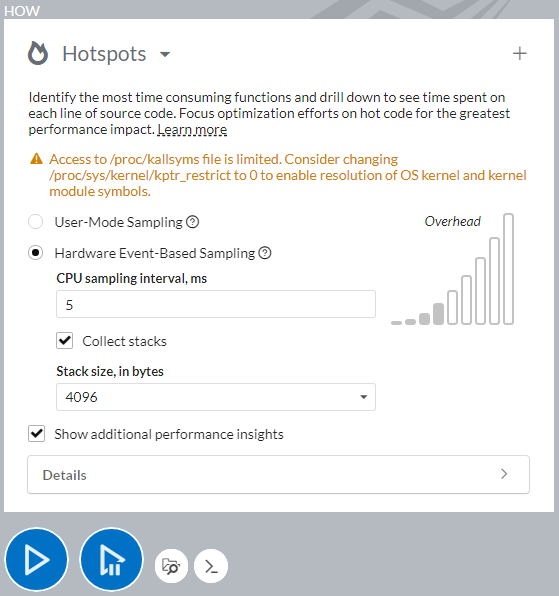
Click Start to run the analysis.
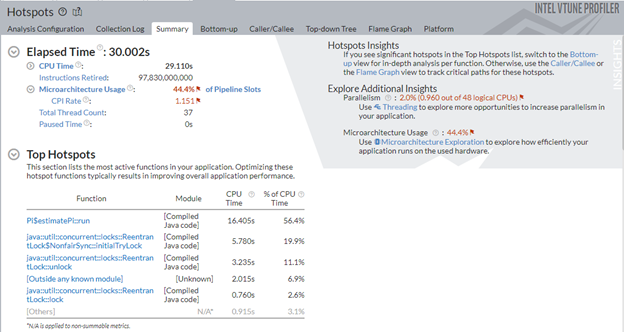
Review Analysis Results
When the collection completes, the Summary tab displays CPU performance information along with a list of hotspots found in the application. You can ignore warnings in the Collection Log about locating debugging information.