Page Faults
This recipe helps identify and measure page faults impact on target application performance by using Intel® VTune™ Profiler's Microarchitecture Exploration, System Overview, and Memory Consumption analyses.
Content expert: Vitaly Slobodskoy
A page fault occurs when a running program accesses a memory page that is not currently mapped to the virtual address space of a process. Mapping is handled by the Memory-Management Unit (MMU) using Translation Lookaside Buffer (TLB) as a cache to reduce the time taken to access a memory location. When a TLB miss occurs, the page may be accessible to the process but not just actually mapped, or the page content may need to be loaded from the storage device issuing a page fault exception. While page faults are a common mechanism for handling virtual memory, their impact on the application performance can be significant due to a variety of ways to increase the page size.
DIRECTIONS:
Ingredients
This section lists the hardware and software tools used for the performance analysis scenario.
Application: matrix app available from the product directory <install-dir>/samples/en/C++. For this recipe, change the size of matrices by modifying the NUM value in src/multiply.h from 2048 to 8192 and rebuild the matrix application by running make from the /linux directory.
Performance analysis tools: Intel® oneAPI Base Toolkit (Beta) > Intel® VTune™ (Beta 04) > Microarchitecture Exploration, System Overview, and Memory Consumption analysis types
NOTE:Starting with the 2020 release, Intel® VTune™ Amplifier has been renamed to Intel® VTune™ Profiler.
Most recipes in the Intel® VTune™ Profiler Performance Analysis Cookbook are flexible. You can apply them to different versions of Intel® VTune™ Profiler. In some cases, minor adjustments may be required.
Get the latest version of Intel® VTune™ Profiler:
From the Intel® VTune™ Profiler product page.
Download the latest standalone package from the Intel® oneAPI standalone components page.
Operating System: Ubuntu* 18.04.1 LTS 64-bit
CPU : Intel® Core™ i7-6700K
Identify TLB Issues with Microarchitecture Exploration Analysis
To get a full picture on the hardware resources usage for your app, run the Microarchitecture Exploration analysis:
Launch the VTune Profiler.
By default, VTune Profiler opens with the sample (matrix) project as current.
NOTE:Make sure this project is configured to launch the matrix application with NUM=8192. Otherwise, create a new project for the updated application.
Click the Configure Analysis... button on the Welcome page.
The Configure Analysis window opens.
In the HOW pane, click the down arrow button and select Microarchitecture Exploration from the Microarchitecture analysis group.
- Click the
 Start button to run the analysis.
 VTune Amplifier collects the data and opens the Summary window with application-level statistics.
Explore the Back-End Bound issues caused by TLB misses:
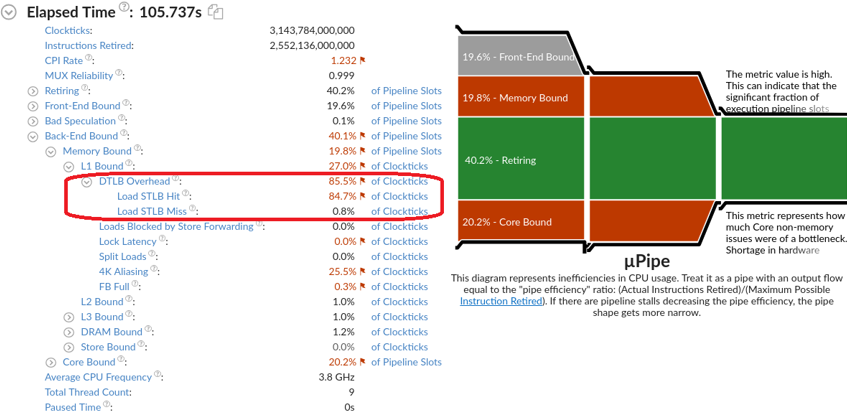
The DTLB Overhead metric estimates the performance penalty paid for missing TLB. Most of the overhead is attributed to the Load STLB Hit metric counting first-level (DTLB) misses that hit the second-level TLB (STLB). There is still a small value of the Load STLB Miss metric representing a fraction of cycles performing a hardware page walk. Beware that these metrics do not account overall time spent within page fault exceptions. So, the Microarchitecture Exploration analysis helps diagnose TLB-related issues, but cannot estimate an impact of page fault exceptions on the application elapsed time.
Trace Kernel Activity with System Overview Analysis
A page fault triggers an interrupt caught by the Linux kernel. To measure exact CPU time spent within the Linux kernel, a more granular analysis is needed. The System Overview analysis in the Hardware Tracing mode uses Intel® Processor Trace technology to capture all the retired branch instructions on CPU cores. In particular, this analysis enables accurate tracing of all the kernel activities including interrupts:
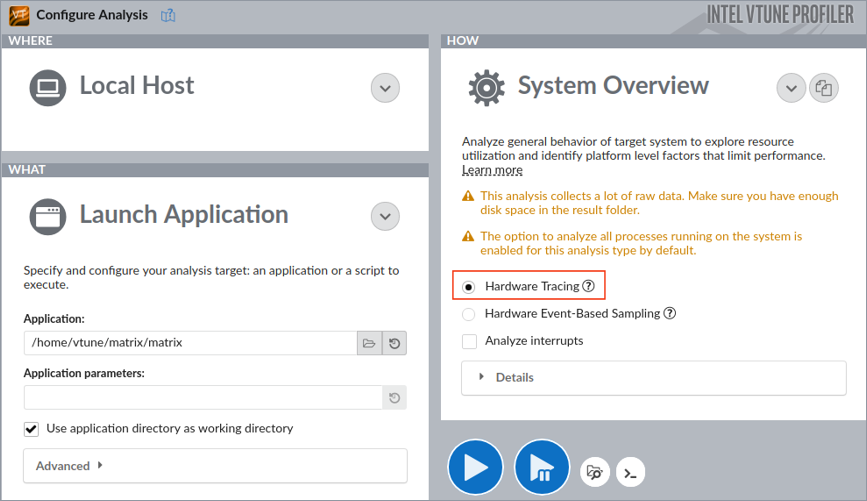
Even with the Launch Application target configuration, this analysis performs a system-wide data collection.
Due to a significant amount of branch instructions, this analysis collects a lot of raw data. You may launch the analysis from the command line and limit the data collection scope to the first 3 seconds:
vtune -collect system-overview -knob collecting-mode=hw-tracing -d 3 -r matrix-so ./matrixBefore launching the vtune command-line interface, make sure to set up the environment variable from the product installation directory: source env/vars.sh.
Open the result in the VTune Profiler GUI:
vtune-gui ./matrix-so
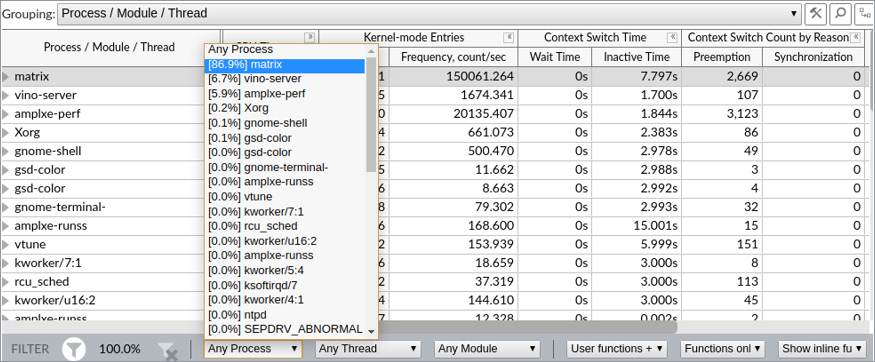
When the result opens, switch to the Platform tab and filter the collected data by the matrix process using the filter bar drop-down menu:
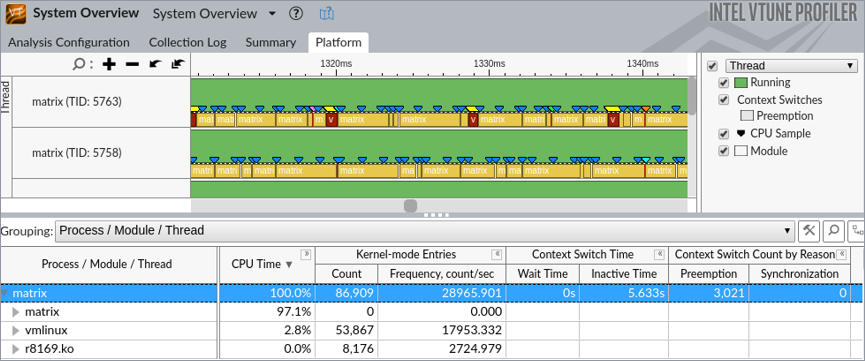
From the Timeline pane that provides an over-time view, you can see that most of the CPU time is spent within the matrix module executing the multiply function. This function is not executed continuously: in a few milliseconds it is usually interrupted, and the heaviest interrupts are caused by page faults:
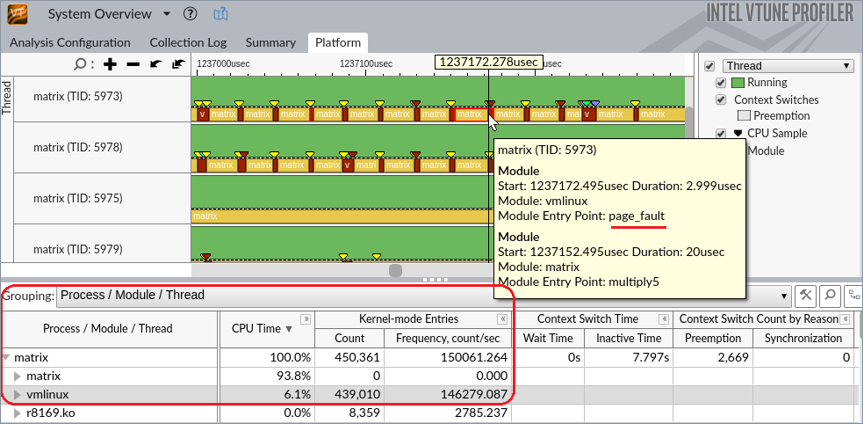
The grid view helps you discover that overall time spent by the sample application within the Linux kernel is 6.1%, where 439K kernel entries occurred just within the first 3 seconds of the application execution. To resolve this, consider using huge pages.
Calculate the Amount of Allocated Memory with Memory Consumption Analysis
To switch to huge pages, define how many pages are needed. For this, calculate the amount of memory the application allocates. For simple applications like matrix, it is trivial to just inspect the source code. For more complex applications, consider using the Memory Consumption analysis. It provides the exact allocated memory size or identify objects that should use huge pages.
Click Configure Analysis to open your matrix project configuration.
In the HOW pane, click the down arrow button and select Memory Consumption from the Hotspots analysis group.
Change the Minimal dynamic memory object size to track option value to 1.
Click the
Start button to run the analysis. VTune Profiler collects the data and opens the Summary window with application-level statistics.
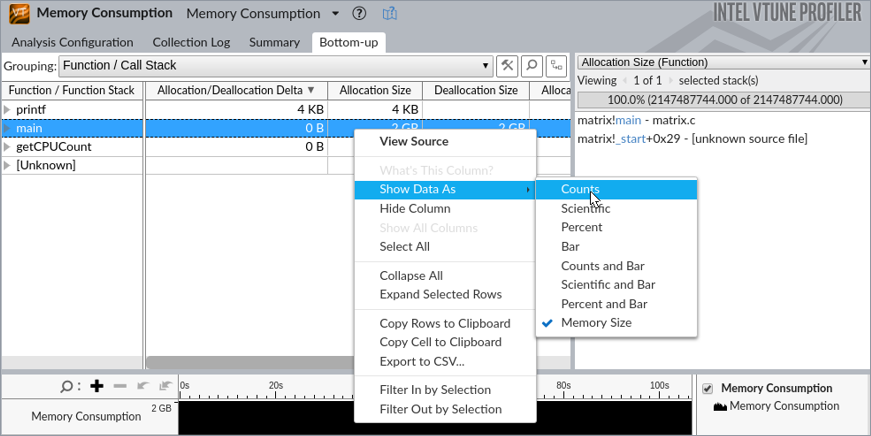
Click the Bottom-up tab. In the Allocation Size column right-click and select Show Data As > Counts for a bytes representation:
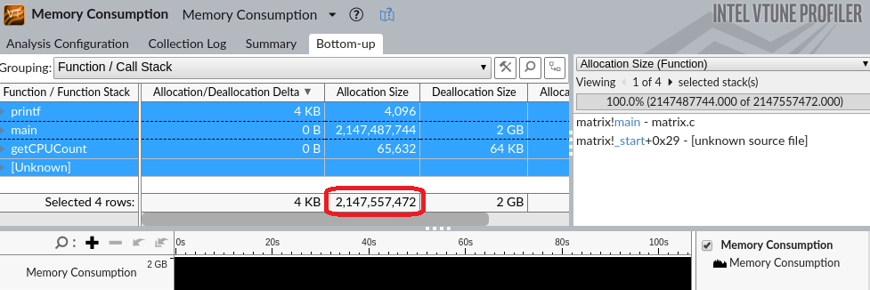
Right-click the grid again and choose Select All (alternatively, press Ctrl-A) to see the total allocation size.
The application allocates 2147557472 bytes:
Reduce Page Faults with Huge Pages
By default, a page size is 4Kb. With huge pages the default page size is 2Mb and it can be increased up to 1Gb. Switching to huge pages is quite easy with libhugetlbfs.
First of all, you need to calculate how many 2Mb pages you need. The sample matrix allocates 2147557472 bytes. This means that you need 2147557472 / 2097152 = 1025 pages of 2Mb (using top rounding).
To switch to huge pages:
Configure the number of pages:
sudo hugeadm --pool-pages-min 2Mb:1025
Create a matrix.sh script with the following content>
#!/bin/bash
LD_PRELOAD=libhugetlbfs.so HUGETLB_MORECORE=yes ./matrix
Set the executable mode for the script:
chmod u+x ./matrix.sh
Re-run the System Overview analysis.
vtune -collect system-overview -knob collecting-mode=hw-tracing -d 3 -r matrix-so-hp ./matrix.shOpen the result in the VTune Profiler GUI:
vtune-gui ./matrix-so-hp
The Platform view now shows 3.3% reduction of kernel CPU time and 8.1x reduction on kernel-mode entries:
Elapsed time of the matrix application with huge pages is reduced from 106,4s to 100,5s, which is around 5% of an overall elapsed time improvement without changing any line of code.