Profiling a .NET* Core Application
This recipe uses Intel® VTune™ Profiler for .NET Core dynamic-code profiling to locate performance hotspots in the managed code and optimize the application turnaround.
Content expert: Denis Pravdin
Ingredients
This section lists the hardware and software tools used for the performance analysis scenario.
Application: a sample C# application that adds all the elements of an integer List. The application is used as a demo and not available for download.
Tools:
Intel® VTune™ Profiler 2018
NOTE:Starting with the 2020 release, Intel® VTune™ Amplifier has been renamed to Intel® VTune™ Profiler.
Most recipes in the Intel® VTune™ Profiler Performance Analysis Cookbook are flexible. You can apply them to different versions of Intel® VTune™ Profiler. In some cases, minor adjustments may be required.
Get the latest version of Intel® VTune™ Profiler:
From the Intel® VTune™ Profiler product page.
Download the latest standalone package from the Intel® oneAPI standalone components page.
Operating system: Microsoft* Windows* 10
CPU: Intel microarchitecture code name Skylake
Prepare Your Application for Analysis
Open a new command window for the .NET environment variables to take effect. Make sure that .NET Core 2.0 is successfully installed:
dotnet --versionCreate a new listadd directory for the application:
mkdir C:\listadd
> cd C:\listadd
Enter dotnet new console to create a new skeleton project with the following structure:
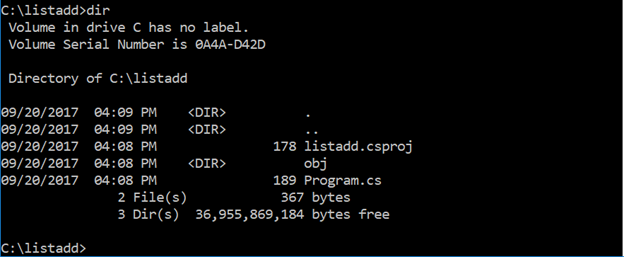
Replace the contents of Program.cs in the listadd folder with C# code that adds the elements of an integer List:
using System;
using System.Linq;
using System.Collections.Generic;

namespace listadd
{
    class Program
    {
        static void Main(string[] args)
        {
            Console.WriteLine("Starting calculation...");
            List<int> numbers = Enumerable.Range(1,10000).ToList();
            for (int i =0; i < 100000; i ++)
            {
                ListAdd(numbers);
            }

            Console.WriteLine("Calculation complete");
        }

        static int ListAdd(List<int> candidateList)
        {
            int result = 0;
            foreach (int item in candidateList)
            {
                result += item;
            }

            return result;
        }
    }
}
Create listadd.dll in the C:\listadd\bin\Release\netcoreapp2.0 folder:
dotnet build -c ReleaseRun the sample application:
dotnet C:\listadd\bin\Release\netcoreapp2.0\listadd.dll
Run Advanced Hotspots Analysis
Launch VTune Profiler with administrator privileges.
Click the
 New Project button on the toolbar and specify a name for the new project, for example: dotnet.
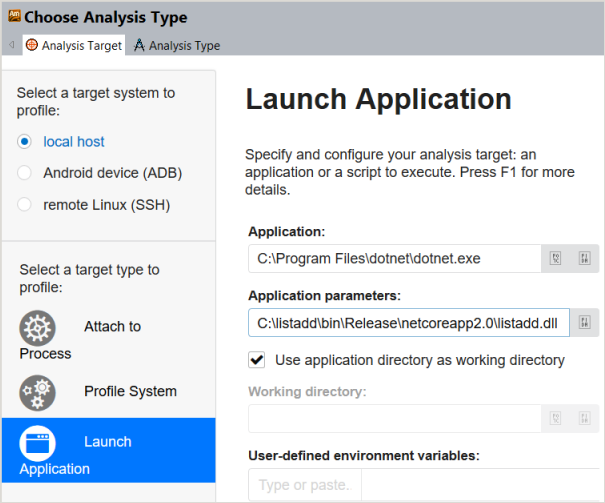
 In the Analysis Target window, select local host and Launch Application target type from the left pane.
On the Launch Application pane, specify the application to analyze:
Application: C:\Program Files\dotnet\dotnet.exe
Application parameters: C:\listadd\bin\Release\netcoreapp2.0\listadd.dll
 NOTE:
NOTE:The location of dotnet.exe depends on your environment and can be identified with the command: where dotnet.
Click the Choose Analysis button on the right and select the Advanced Hotspots analysis from the left pane.
NOTE:Advanced Hotspots analysis was integrated into the generic Hotspots analysis starting with Intel VTune Amplifier 2019, and is available via the Hardware Event-Based Sampling collection mode.
Click Start to run the analysis.
Identify Hotspots in the Managed Code
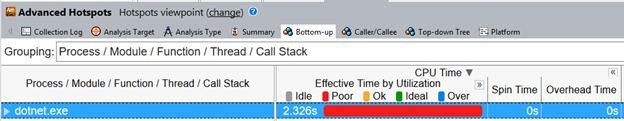
When the collected analysis result opens, switch to the Bottom-up tab and set the data grouping level to Process/Module/Function/Thread/Call Stack:
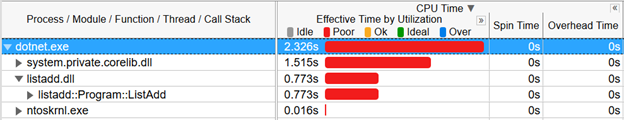
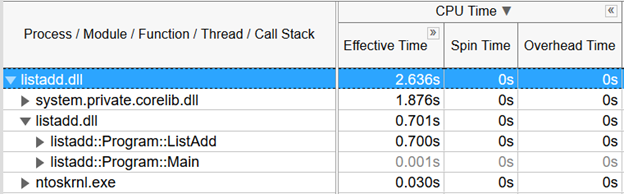
Expanding dotnet.exe > listadd.dll discovers the managed listadd::Program::ListAdd function that took the most CPU Time:
Double-click this hotspot function to open the source view. To view the source and disassembly code side by side, click the Assembly toggle button on the toolbar:
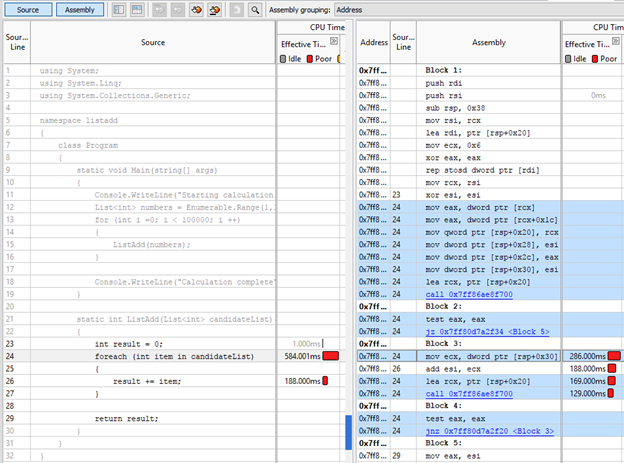
Use the statistics per source line/assembly instruction to identify the most time-consuming code snippets (line 24 in the example above) and work on optimizations.
Optimize the Code with Loop Interchange
VTune Amplifier highlights the following code line as performance-critical:
foreach (int item in candidateList)
For optimization, consider using the for loop statement. Replace the contents of Program.cs with this C# code:
using System;
using System.Linq;
using System.Collections.Generic;

namespace listadd
{
    class Program
    {
        static void Main(string[] args)
        {
            Console.WriteLine("Starting calculation...");
            List<int> numbers = Enumerable.Range(1,10000).ToList();
            for (int i =0; i < 100000; i ++)
            {
                ListAdd(numbers);
            }

            Console.WriteLine("Calculation complete");
        }

        static int ListAdd(List<int> candidateList)
        {
            int result = 0;
            for (int i = 0; i < candidateList.Count; i++)
            {
                result += candidateList[i];
            }

            return result;
        }
    }
}
Verify the Optimization
To verify the optimization for the updated code, re-run the Advanced Hotspots analysis.
Before the optimization the sample application took 2.636 seconds of CPU time:
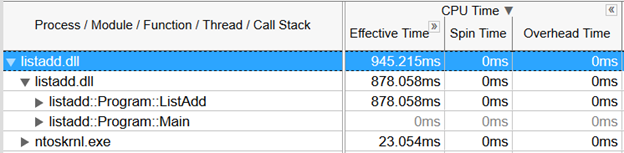
After optimization the application ran for 0.945s, which is a 64% reduction in time over the original:
To discuss this recipe, visit the developer forum