Core Utilization in DPDK Apps
This recipe explores metrics that characterize core utilization in terms of packet receiving in DPDK-based applications.
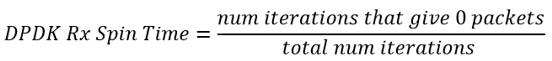
In data plane applications, where fast packet processing is required, the DPDK is supposed to poll a certain port for incoming packets in an infinite loop, pinned to a certain logical core. Such a polling model of packet retrieval poses a challenge of measuring effective core utilization. Obviously, the CPU time on the core, where the polling loop is running, is always close to 100%, regardless of how many loop cycles the DPDK runs idle. So, the CPU time cannot reflect how the core is utilized on the packet retrieval. However, for this polling model, the core utilization indicator might be Rx Spin Time - % of wasted polling loop cycles. Wasted Cycles are such iterations during which the DPDK does not receive any packets.
This recipe applies the following steps to analyze the efficiency of packet retrieving in a DPDK-based workload:
Ingredients
Application: a DPDK testpmd app running on one core and performing L2 forwarding. The application is compiled against DPDK with the VTune Profiler profiling enabled.
Tools:
DPDK with VTune Profiler profiling support enabled. VTune Profiler profiling support is integrated into DPDK since version 18.11. When using earlier versions, apply the attached patches (available for versions 17.11, 18.02, and 18.05). To enable profiling on the DPDK side, enable the VTune Profiler to attach to the DPDK polling cycle. For this, reconfigure and recompile the DPDK (and the target application) with the CONFIG_RTE_ETHDEV_RXTX_CALLBACKS and CONFIG_RTE_ETHDEV_PROFILE_WITH_VTUNE flags enabled (located in the config/common_base config file).
Intel® VTune™ Profiler: Input and Output analysis
NOTE:Starting with the 2020 release, Intel® VTune™ Amplifier has been renamed to Intel® VTune™ Profiler.
Most recipes in the Intel® VTune™ Profiler Performance Analysis Cookbook are flexible. You can apply them to different versions of Intel® VTune™ Profiler. In some cases, minor adjustments may be required.
Get the latest version of Intel® VTune™ Profiler:
From the Intel® VTune™ Profiler product page.
Download the latest standalone package from the Intel® oneAPI standalone components page.
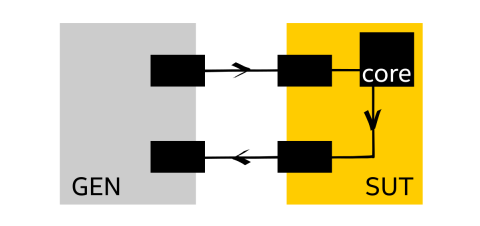
Operating system: Test system that consists of the traffic generator (GEN in the picture below) providing 64-byte frames and packet receiver (SUT - system under test), connected via 40 GbE link. The SUT performs L2 forwarding of packets.
CPU: Intel® Xeon® Platinum 8180 (38.5M Cache, 2.5 GHz, 28 cores)
Run Input and Output Analysis
For DPDK analysis, select the Input and Output analysis and enable the DPDK IO API option in the VTune Profiler GUI:
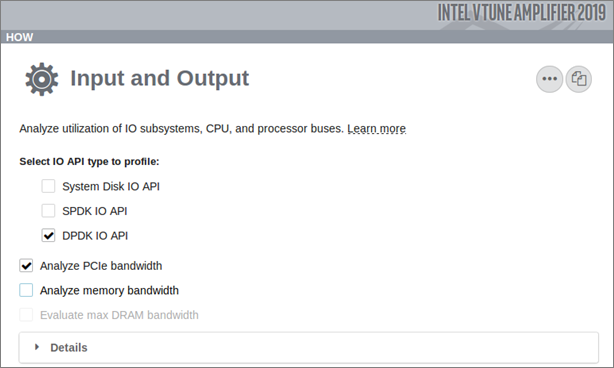
You may correlate API-specific metrics, such as DPDK Rx Spin Time, with the hardware events and hardware event-based metrics. For example, you can see the dependency between DPDK Rx Spin Time and PCIe bandwidth that can be collected when the Analyze PCIe bandwidth option is enabled.
To run Input and Output analysis with PCIe bandwidth and DPDK metrics from command line, execute the following command as a root, which enables getting per-device PCIe bandwidth with human-readable names:
amplxe-cl -collect io -knob kernel-stack=false -knob dpdk=true -knob collect-pcie-bandwidth=true -knob collect-memory-bandwidth=false -knob dram-bandwidth-limits=false --target-process=testpmdAnalyze Core Utilization with the DPDK Rx Spin Time Metric
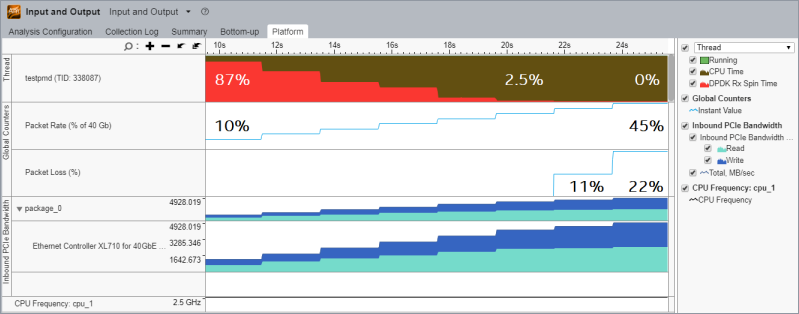
When the data is collected, start your analysis with the Platform tab and explore the DPDK Rx Spin Time overtime metric that refers to a thread. This metric shows (on a per-thread basis) a portion of rte_eth_rx_burst(...) function calls that return zero packets, which is identical to the fraction of polling loop iterations that provide no packets:
The result demonstrated in this recipe is synthetic.
On the Platform view above, the CPU Time (brown) for the polling thread is always close to 100%. The DPDK Rx Spin Time (red) illustrates thread utilization in terms of packet retrieving. Hover the mouse over the charts to find values at each moment of time in the tooltip.
In this example, the traffic generator was automated to increase the traffic rate every two seconds by 5% of 40 Gbps and collect packet loss data. Overtime data written to a properly formatted *.csv file can be imported to a VTune Profiler project and visualized on its timeline.
By default, the VTune Profiler cannot collect the Packet Rate and Packet Loss metrics displayed in the Global Counters section above. For this recipe, these metrics were collected separately and manually imported to the result collected by the VTune Profiler. As an alternative, you can use the custom collector feature of the VTune Profiler to import a csv file with additional metrics. The custom collector is an extra process executed by the VTune Profiler at the collection start / stop / pause. You can use the custom collector to implement all the system automation and collect additional metrics. This makes the experiment reproducible and results valid for comparison, which is definitely useful for consequential performance tuning.
At the bottom of the Platform view, you can see how the Inbound PCIe Bandwidth was changing over time. Since the analysis was run on the Intel microarchitecture code named Skylake with root privileges, PCIe Bandwidth is decomposed by PCIe devices with human readable names.
All metrics on the Input and Output Platform view above are correlated. As the traffic generation rate grows, the Inbound PCIe Bandwidth increases and DPDK Rx Spin Time goes down. At some point, the test system gets overloaded and a non-zero Packet Loss value shows up.
If a thread processes several Rx Queues, the DPDK Rx Spin Time metric will represent composite statistics.
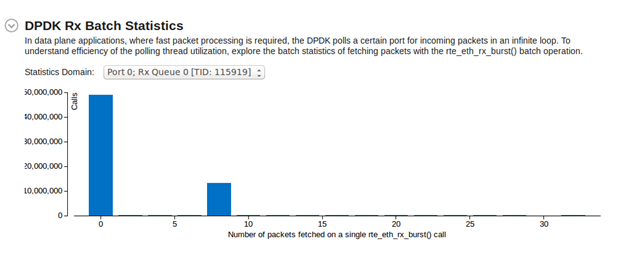
Analyze Packets Retrieval with DPDK Rx Batch Statistics Histogram
DPDK uses the rte_eth_rx_burst(...) function to receive batches of packets from the NIC. It can retrieve any number of packets in the interval (0, MAX_NB_PKTS) , where MAX_NB_PKTS is a constant value (typically, 32). Hence, with the fixed Rx Spin Time, the core may process far different traffic, so Rx Spin Time does not represent a full picture.
To see summary statistics for packet retrieving and get a full characterization of core utilization on Rx, switch to the Summary tab and explore the DPDK Rx Batch Statistics histogram:
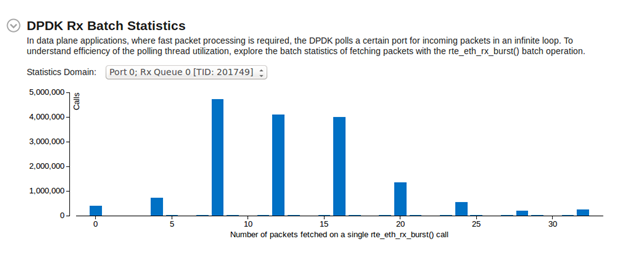
This histogram represents statistics on receiving batch packets for the selected Port / Rx Queue / TID grouping. In this example, all the peaks show values multiple of 4. This is not a coincidence and the root cause investigation requires understanding the background of the packet receiving.
Understand Rx Operations and Investigate Rx Peaks
To receive packets, the working core communicates with the NIC through the Rx descriptors that are data structures keeping the information about the packet, such as its address, size, and so on. The Rx descriptors are joint into ring buffers called Rx Queues. In simple terms, the packet receiving is the race in the ring buffer, where the NIC fills in the Rx descriptors from the ring buffer Head and working core polls, processes and frees Rx descriptors coming from the Tail:
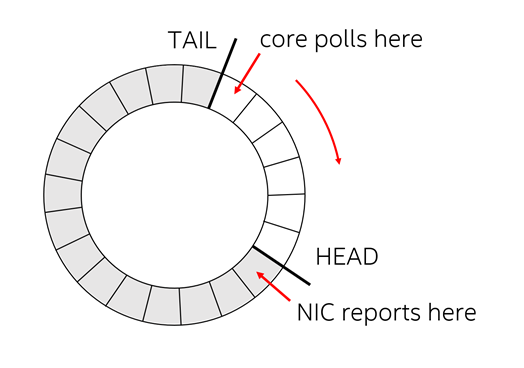
When the core frees Rx descriptors, it moves the Tail pointer forward. When the Tail reaches the Head, rte_eth_rx_burst() can return 0 packets. In the opposite case, when the Head reaches the Tail, there are no free Rx descriptors in the Rx Queue and packet loss may occur.
To deliver a new packet, the NIC reads the Rx descriptor in the Head of the Rx Queue and transfers the packet to the memory by the address specified by the core in the descriptor. Then, it has to write back the Rx descriptor to notify the core on the new packet arrival.
Intel® Ethernet Controller XL710, used in the recipe setup, supports 16 and 32 Byte Rx descriptors. Both are less than the cache line size, therefore the NIC has the descriptor write back policy denoting that NIC should coalesce writes by packing Rx descriptors into the integer number of cache lines to save PCIe bandwidth. Primarily, the XL710 writes back completed Rx descriptors when the following requirements are met:
4 x 32 Byte descriptors or 8 x 16 Byte descriptors are completed.
A descriptor is invalidated in the internal NIC cache.
Refer to the Intel Ethernet Controller X710/ XXV710/XL710 Datasheet for more details.
In this recipe, the system was employing 32 Byte Rx descriptors, that is why most peaks of the DPDK Rx Batch Histogram mark values multiple of 4.
DPDK allows toggling the Rx descriptor size. See below how the DPDK Rx Batch Histogram changes when running testpmd with 32 and 16 Byte Rx descriptors under medium load:
32 Byte Rx descriptor: Most of rte_eth_rx_burst() calls receive 4 packets.
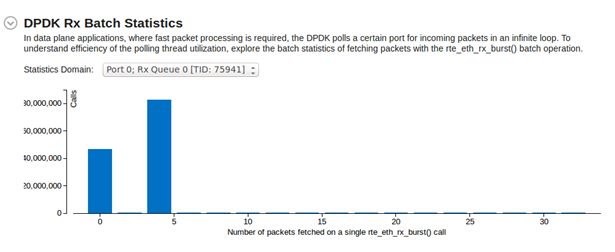
16 Byte Rx descriptor: Most of rte_eth_rx_burst() calls receive 8 packets.