Improving Hotspot Observability in a C++ Application Using Flame Graphs
See how the Flame Graph feature of Intel® VTune™ Profiler can help in a scenario where the true hotspot is obscured behind template functions and long function names.
Content experts: Dmitry Kolosov, Roman Khatko
The Flame Graph is a feature of the Hotspots analysis of Intel® VTune Profiler that visualizes application execution paths in an intuitive visual form.
In some cases, finding a hotspot using the Top Hotspots section of the Summary tab or the Bottom-up window is difficult. Some examples are:
- Applications with flat hotspots, or multiple hotspots with CPU Time spread evenly across many hotspots.
- Applications with nonactionable hotspots:
- Library function calls (STL, Boost, MKL, …) are on the top of stacks, and the caller is not easily findable.
- Template functions with long and complicated names.
In such cases, the Flame Graph helps identify true hotspots and hot code paths by providing greater observability for all application stacks. This increase in observability can save time and effort when analyzing applications with complex stacks.
This feature supports workloads written in all languages that are supported by the Hotspots analysis, including—but not limited to:
- C++
- FORTRAN
- Java
- .NET
- Python
This recipe demonstrates how the Flame Graph can help identify hot paths in your code more easily, especially in cases where the real hotspot is obscured, or there are multiple hotspots.
- Ingredients
- Directions
Ingredients
This section lists the hardware and software tools used for the performance analysis scenario:
- Application: C++ STL/Boost* based sample.
Boost is a set of libraries for C++ that supports tasks and structures such as linear algebra, pseudorandom number generation, multithreading, and more.
In this example, Boost 1.77.0 for Windows* is used (download sources or binaries).
- Performance analysis tool: Intel® VTune™ Profiler 2021.9—Hotspots analysis
- Operating system: Microsoft Windows Server* 2016
- IDE: Microsoft Visual Studio* 2017
- CPU: Intel® Xeon® E5-2695 v3 (formerly codenamed Haswell)
Configure Project and Build Sample
As a first step, we will build and analyze the sample application below to establish a performance baseline.
The sample code below splits random-generated long text (100 million words) by words in a service thread. It contains four implementations that handle the task differently:
| Implementation | Uses Function | Based On |
|---|---|---|
| 1 | splitByWordsBoost | boost::split |
| 2 | splitByWordsStdString | std::string::find and std::string::substr |
| 3 | splitByWordsStdStringView | std::string_view::find and std::string_view::substr and std::vector of string_view |
| 4 | splitByWordsStdStringView | pre-allocated output vector |
Each implementation is selectable by a command-line parameter. Over the course of this recipe, we will switch between different implementations to analyze how the performance changes.
#include <iostream>
#include <vector>
#include <chrono>
#include <thread>
#include <string_view>

#include <boost/algorithm/string.hpp>

using namespace std::chrono;

void generateRandomText(std::string& text, const size_t words, const size_t symbolsInWord)
{
	for (size_t i = 0; i < words; i++)
	{
		for (size_t j = 0; j < symbolsInWord; j++)
		{
			text += 'a' + i % 26;
		}
		text += ' ';
	}
}

void splitByWordsBoost(const std::string& text, std::vector<std::string>& splitWords)
{
	boost::split(splitWords, text, boost::is_any_of(" "));
}

void splitByWordsStdString(const std::string& text, std::vector<std::string>& splitWords)
{
	const char delimiter = ' ';
	size_t start, end = 0;
	while ((start = text.find_first_not_of(delimiter, end)) != std::string::npos) {
		end = text.find(delimiter, start);
		splitWords.push_back(text.substr(start, end - start));
	}
}

void splitByWordsStdStringView(const std::string& text, std::vector<std::string_view>& splitWords)
{
	const char delimiter = ' ';
	size_t start, end = 0;
	std::string_view textView(text);
	while ((start = textView.find_first_not_of(delimiter, end)) != std::string::npos) {
		end = textView.find(delimiter, start);
		splitWords.emplace_back(textView.substr(start, end - start));
	}
}

int main(int argc, char** argv)
{
	int splitMode = 0;
	const char* msg = "splitByWordsBoost";
	if (argc > 1)
	{
		switch (*argv[1])
		{
		case '2': splitMode = 1; msg = "splitByWordsStdString"; break;
		case '3': splitMode = 2; msg = "splitByWordsStdStringView"; break;
		case '4': splitMode = 3; msg = "splitByWordsStdStringView(pre-allocated vector)"; break;
		}
	}

	const size_t numOfWords = 100000000, symbolsInWord = 10;
	std::string text;
	text.reserve(numOfWords * (symbolsInWord+1));

	std::cout << "Generating random text: ";
	auto start = high_resolution_clock::now();
	generateRandomText(text, numOfWords, symbolsInWord);
	auto stop = high_resolution_clock::now();
	std::cout << duration_cast<duration<float>>(stop - start).count() << " seconds" << std::endl;

	std::vector<std::string> splitWords;
	std::vector<std::string_view> splitWordsView;
	if (splitMode == 3) splitWordsView.reserve(numOfWords);

	std::cout << msg << " function: ";
	std::thread thread;
	start = high_resolution_clock::now();
	switch (splitMode)
	{
	case 0: thread = std::thread(splitByWordsBoost, std::ref(text), std::ref(splitWords)); break;
	case 1: thread = std::thread(splitByWordsStdString, std::ref(text), std::ref(splitWords)); break;
	case 2:
	case 3: thread = std::thread(splitByWordsStdStringView, std::ref(text), std::ref(splitWordsView)); break;
	}
	thread.join();
	stop = high_resolution_clock::now();

	std::cout << duration_cast<duration<float>>(stop - start).count() << " seconds" << std::endl;
	auto splitWordsSize = splitMode >= 2 ? splitWordsView.size() : splitWords.size();
	std::cout << "Split words: " << splitWordsSize << std::endl;
}
The code can be copied over to a newly created C++ project, such as Console App or Empty Project in Visual Studio 2017, or any newer Visual Studio version with C++17 support.
Since the sample depends on the Boost library, additional configuration steps are required.
Follow these steps to set up the project in Visual Studio:
- Right-click on the project node in the Solution Explorer and select Properties.
- In the Project Property Pages window, make sure the Configuration drop-down is set to Release and Platform is set to x64.
- In the VC++ Directories page, add the root Boost directory to Include Directories.
- In the VC++ Directories page, add the Boost libraries directory to Library Directories.
The default directory is:
<boost-root-directory>\libs
- In the C/C++ > Language page, make sure the C++ Language Standard option is set to ISO C++17 Standard (/std:c++17).
The configuration is now ready.
g++ -Wall -O2 -g -pthread -std=c++17 -l <path-to-boost-dir> ConsoleApplication1.cpp -o ConsoleApplication1Build the project in the Release x64 configuration. Once compiled, different implementations of the algorithm can be selected by using the <option> parameter:
>ConsoleApplication1.exe <option>
where <option> is: 1, 2, 3, or 4.
The application defaults to 1 if no arguments are given, so as a first step, run the application without parameters:
>ConsoleApplication1.exe
Establish Performance Baseline
For the next step, run the Hotspots analysis of VTune Profiler with the application using the first implementation—the one that is based on the boost::split function. The result of this analysis will become our performance baseline, against which we will compare future optimizations.
Run VTune Profiler and start your analysis:
- Click the New Project button on the toolbar and specify a name for the new project, such as split_string.
- Click Create Project.
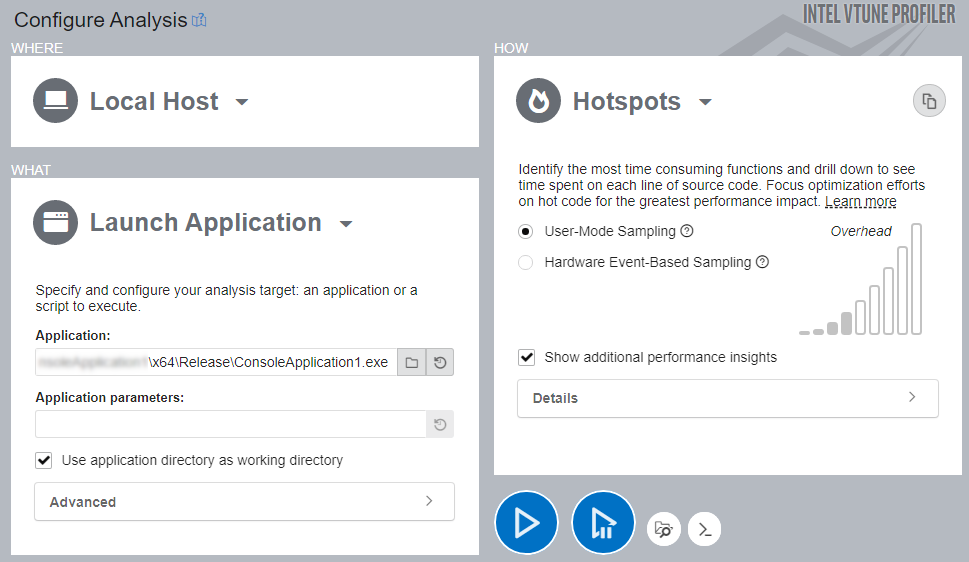
The Configure Analysis window opens.
- On the WHERE pane, select the Local Host target system.
- On the WHAT pane, select the Launch Application mode.
- In the Application textbox, provide the path to the built application binary.
- On the HOW pane, select the Hotspots analysis.
- Click Start to run the analysis.
VTune Profiler launches the application and collects all necessary data before finalizing the result.
On the system specified in the Ingredients section, the total application working time is about 17 seconds.
Analyze Hotspots Result with Summary and Bottom-up Windows
Start your investigation with the Summary window that shows high-level information on application performance.
Focus on the Elapsed Time value and the Top Hotspots section that contains the list of hottest functions, in decreasing order.
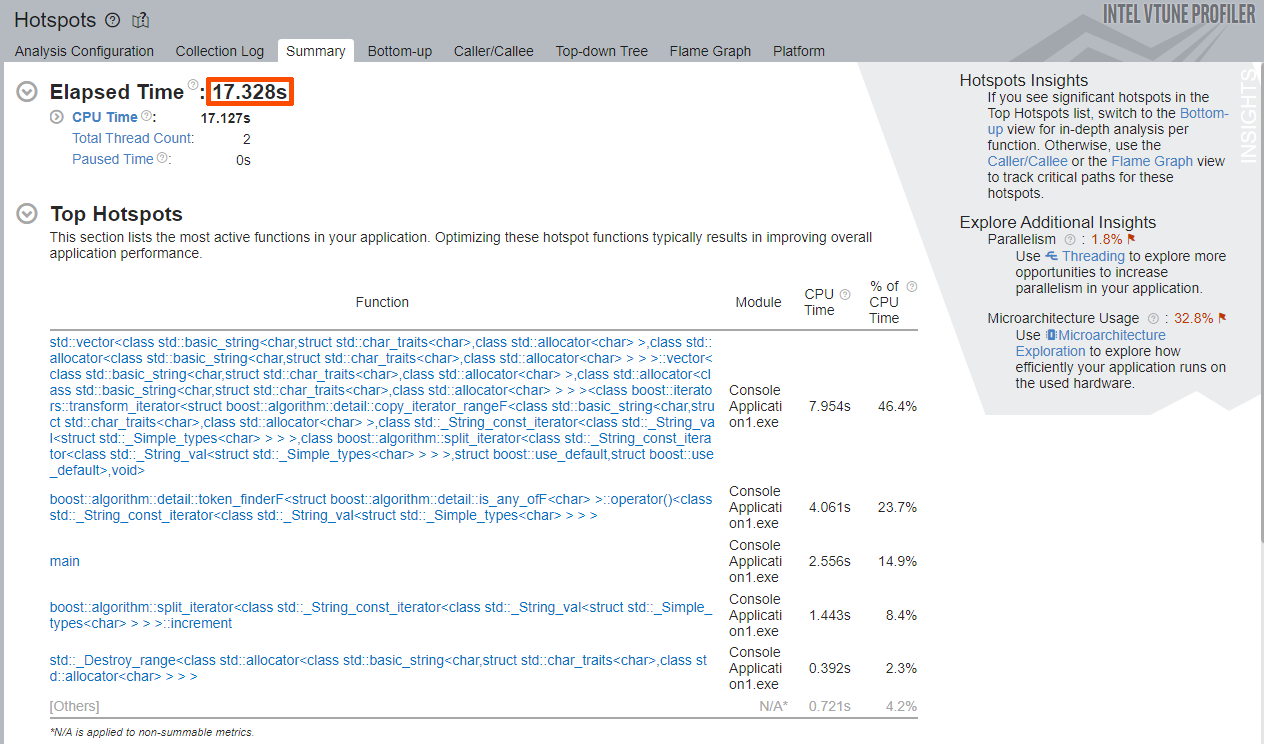
The Elapsed Time of the sample application is about 17 seconds.
The Top Hotspots are:
| std::vector template | 46.4% of CPU Time |
| boost::algorithm::detail::token_finderF template | 23.7% of CPU Time |
| main function | 14.9% of CPU Time |
| boost::algorithm::split_iterator template | 8.4% of CPU Time |
Note that the splitByWordsBoost or boost::split functions are not on the list. Since the Top Hotspots list only contains template functions and the main function, it does not make sense to start optimizations with the functions highlighted on the Summary window. The real hotspot is likely obscured by the template functions.
Try finding the hotspot in the Bottom-up window. Switch to the Bottom-up window to observe more hotspots related to splitByWordsBoost and boost::split functions that are the focus of our attention.
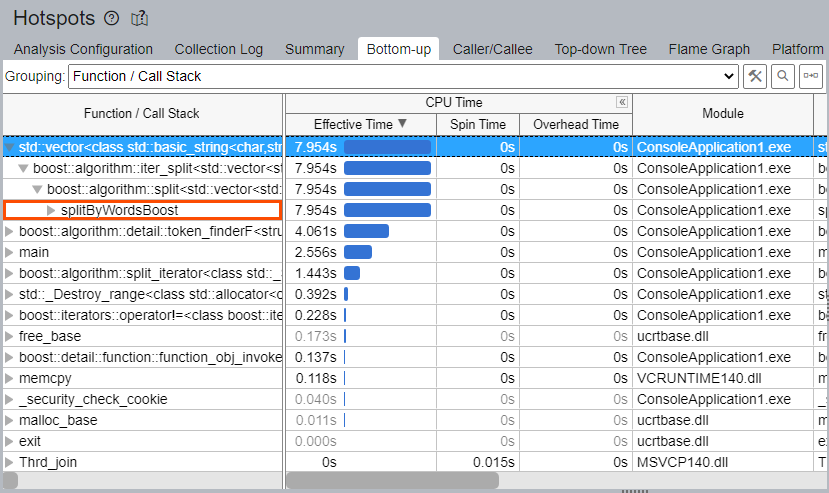
The Bottom-up window shows more functions and/or hotspots, but the splitByWordsBoost and boost::split functions are not at the top of the list. The target function and its relationship to the identified hotspots is not obvious.
If you expand the callers of the std::vector and boost::algorithm::split, the splitByWordsBoost function can only be found on the 3rd-4th levels and takes 7.954 seconds—46.4% of CPU Time—out of the total 17.328 seconds of Elapsed Time.
In such cases—when the hotspot is obscured by the template functions it calls—it may be more productive to use the Flame Graph to eliminate any unnecessary guesswork and effort related to figuring out the relations between hot functions.
Open the Flame Graph window to observe all application stacks, frames, and hot code paths.
Identify Hot Code Paths on the Flame Graph
A Flame Graph is a visual representation of the stacks and stack frames in your application. Each box in the graph represents a stack frame with the complete function name. The horizontal axis shows the stack profile population, sorted alphabetically. The vertical axis is the stack depth, starting from zero at the bottom.
Note that the Flame Graph is not a timeline, so it does not display data over time. The width of each box in the graph is proportional to the amount of CPU Time taken by this function out of the total CPU Time. The total function time includes processing times of the function and all its children (callees).
Start optimizing from the bottom functions and move up. Pay attention to the hot (wide) functions first.
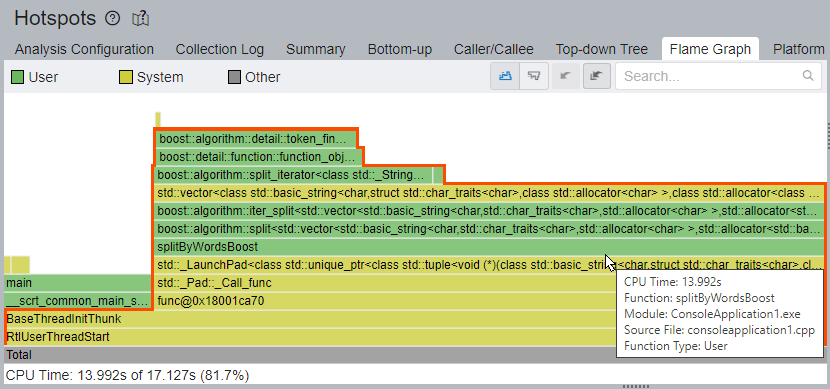
In case of this application, note that the Flame Graph provides perfect observability and presents a clear hot code path. Here, the path passes through the splitByWordsBoost and the boost::algorigthm::split functions, and arrives at std::vector and boost template frames at the top. The splitByWordsBoost function and its callees take 13.992 seconds (81.7%) of all CPU Time.
The Flame Graph works in conjunction with the Timeline pane and the Filter toolbar, which enables you to filter data by time region, process, thread, etc. The Timeline pane shows two application threads: main and service. The splitByWordsBoost function works in the service thread, so it makes sense to filter data by service thread via the Filter By Thread drop-down to make the Flame Graph view cleaner. In this case, the service thread is the thread func@0x18001ca70 (TID:22200).
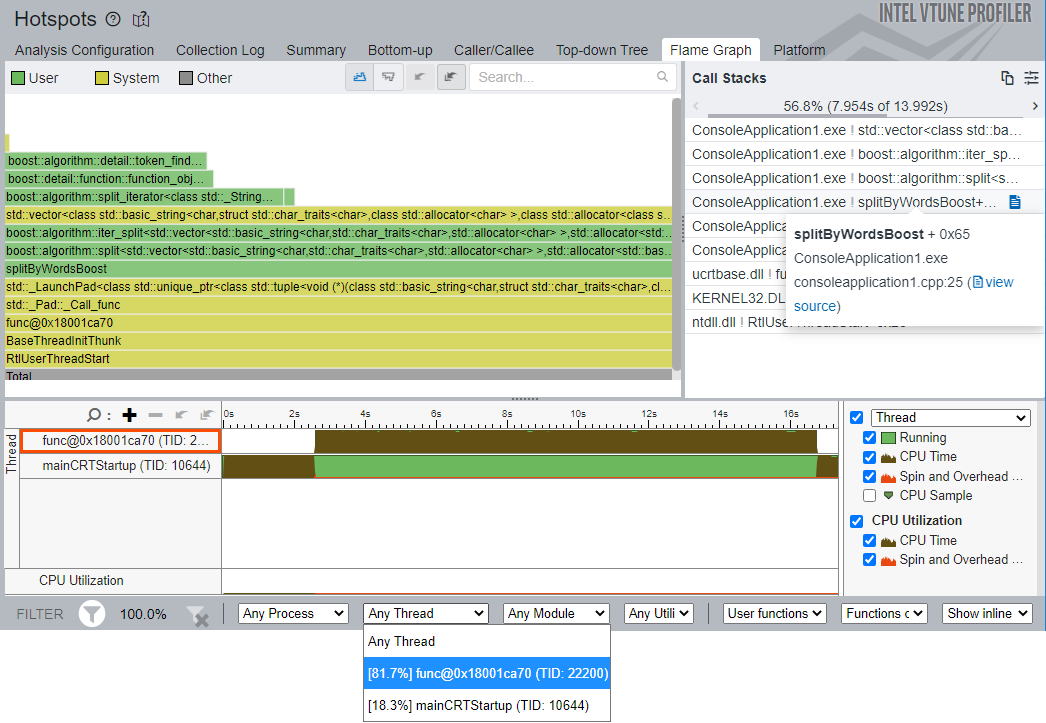
The Call Stacks pane on the right responds to selection/zoom on the Flame Graph and shows stacks with frames passing through a selected function. Hover over and click the splitByWordsBoost function in the Call Stacks pane to drill down to Source/Assembly view. The source view shows an obvious hotspot on the boost::split function.

This implementation could use some optimization. However, we cannot optimize the library function boost::algorithm::split. Therefore, we will try our own implementation of the split function based on std::string::find.
Analyze Second Implementation
To analyze the code with the second implementation of the splitter function, open the Configure Analysis dialog and add 2 to the Application Parameters field. This enables the second implementation inside the application.
Click Start to run the analysis.
Once the analysis is done, pay attention to the Elapsed Time value and the Top Hotspots section of the Summary window.
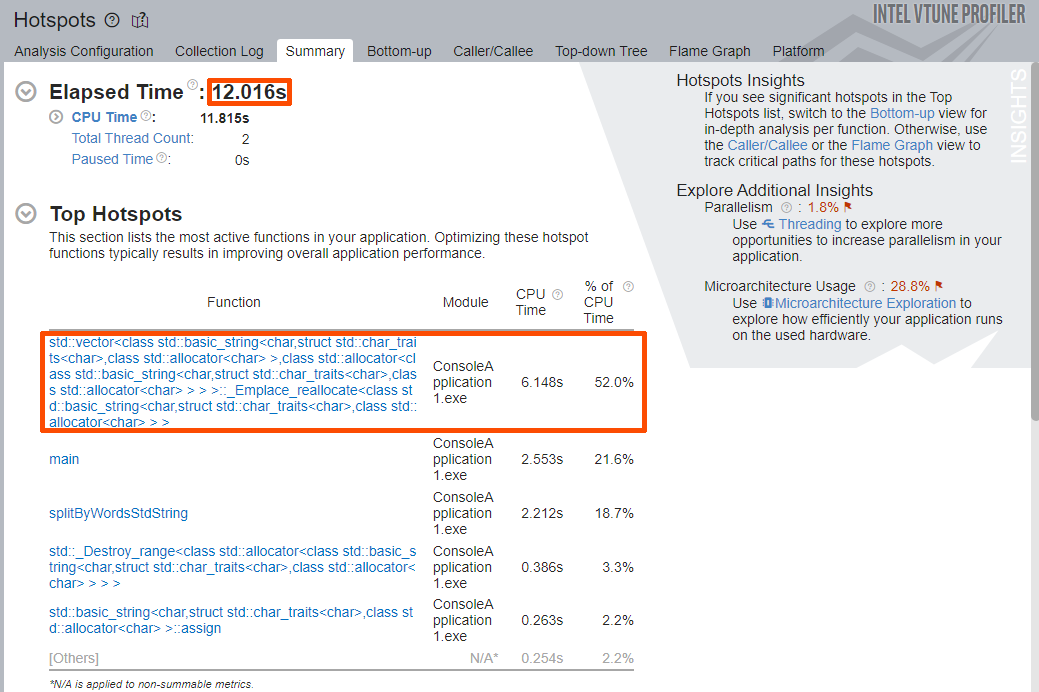
The Elapsed Time was decreased from roughly 17 seconds to roughly 12 seconds. The Top Hotspots section shows a new list of functions, including the application function splitByWordsStdString.
The top hotspot is the std::vector<> template with vector re-allocation (_Emplace_reallocate) and the std::string object constructor. These template functions are showing up as hotspots since our splitByWordsStdString function performs other operations that are expensive in terms of overhead: it constructs new std::string objects and often re-allocates the buffer for our output vector.
Switch to the Flame Graph window to get the full picture of the application stacks.
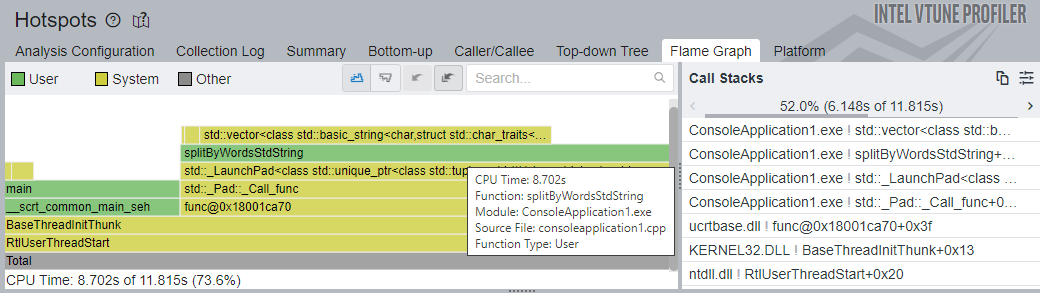
A clear hot path is passing through the splitByWordsStdString function, with the std::vector template frame at the top. The splitByWordsStdString function and its callees take 8.702 seconds (73.6%) of all CPU Time vs 13.992 seconds (81.7%) of the previous implementation. A large portion of CPU Time is still spent on vector re-allocation and string creation.
Therefore, let us try one more implementation based on std::string_view of the C++17 standard, which offers the benefits of the std::string interface without the cost of constructing an std::string object. The output vector will contain std::string_view objects.
Analyze Third Implementation
To analyze the code with the third implementation of the splitter function, open the Configure Analysis dialog and add 3 to the Application Parameters field. This enables the second implementation inside the application.
Click Start to run the analysis.
Once the analysis is done, pay attention to the Elapsed Time value and the Top Hotspots section of the Summary window.
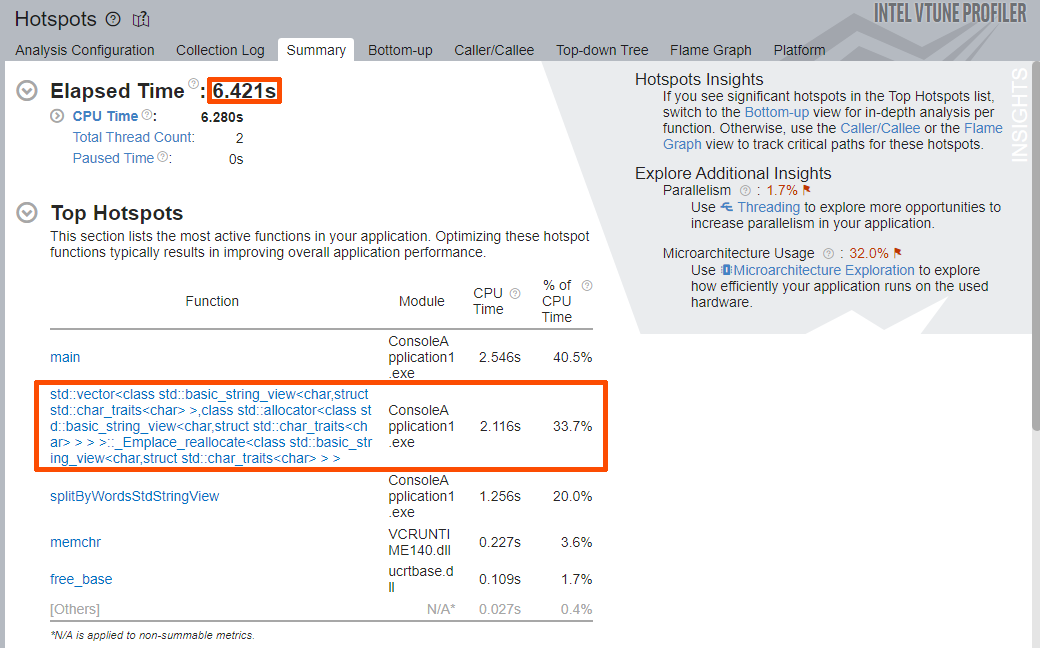
Once again, the Elapsed Time of the application was decreased from roughly 12 seconds to roughly 6.5 seconds.
The Top Hotspots section shows a new list of functions, including the application function splitByWordsStdStringView. The top hotspot is the main function, which poses no interest in terms of optimization. The second hotspot is the std::vector<> template with vector re-allocation (_Emplace_reallocate).
The splitByWordsStdStingView function adds split words to the vector of string_view objects, bypassing many std::string object creations. This has increased the split function performance significantly.
Switch to the Flame Graph window to get the full picture of the application stacks.
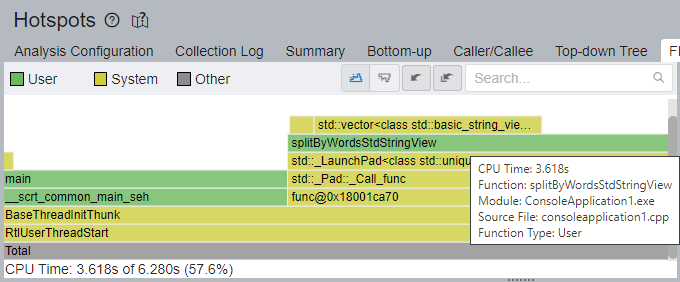
A clear hot path is passing through the splitByWordsStdStringView function, with the std::vector template frame at the top. The splitByWordsStdStringView function and its callees take 3.618 seconds (57.6%) of total CPU Time, compared to 8.702 seconds (73.6%) of the previous run.
Let us try the final implementation of the splitter function based on std::string_vew, this time using pre-allocation of the output vector by using the std::vector<>::reserve method. If we can roughly estimate the amount of data that is going into our vector, we might as well pre-allocate some buffer space to avoid most of the re-allocations.
Analyze Fourth Implementation
To analyze the code with the fourth implementation of the splitter function, open the Configure Analysis dialog and add 4 to the Application Parameters field. This enables the second implementation inside the application.
Click Start to run the analysis.
Once the analysis is done, pay attention to the Elapsed Time value and the Top Hotspots section of the Summary window.
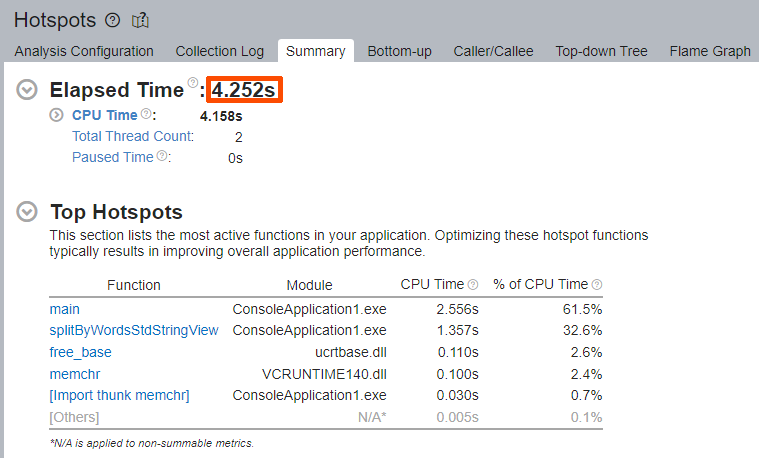
Once again, the Elapsed Time was decreased from 6.421 to 4.252 seconds. There are no STL template functions among the Top Hotspots.
Switch to the Flame Graph window to get the full picture of the application stacks.
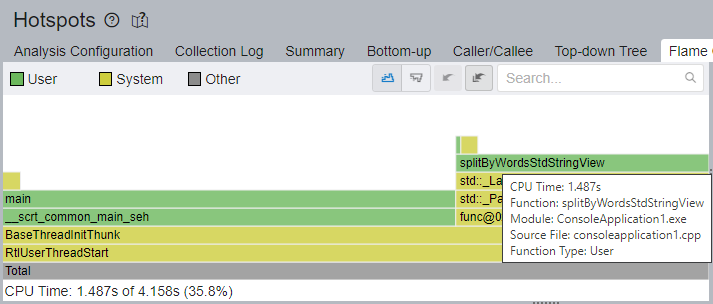
The hottest code path is passing through the main function now. The splitByWordsStdStringView function and its callees take 1.487 seconds (35.8%) of CPU Time, compared to 3.618 seconds (57.6%) from the previous run.
Summary
Considering the current gains in performance, optimization activities are stopped.
At each step of the iterative optimization process, the Flame Graph helped by being a visual guide into the stack profiles of our application. In real projects, finding hotspots may not be as easy as looking at the Top Hotspots section, and the Flame Graph can help uncover the hot paths that require optimization with less time and effort.
Here is how the optimizations progressed with each iteration:
| Iteration | Elapsed Time, s | Split Function CPU Time, s |
|---|---|---|
| 1 | 17.328 | 13.992 |
| 2 | 12.016 | 8.702 |
| 3 | 6.421 | 3.618 |
| 4 | 4.252 | 1.484 |
| Total | - 13.076 | - 12.508 |
On second implementation, we discovered that the std::string implementation could also use some improvement. The third implementation used std::string_view to avoid constant std::string object creations and copying of string buffers, which improved performance. Finally, we opted to pre-allocate some space to our output vector to bypass frequent re-allocation operations.
All these optimizations enabled our application to perform the same amount of work in roughly 4 seconds, compared to roughly 17 seconds at the start.