Inefficient TCP/IP Synchronization
This recipe shows how to locate inefficient TCP/IP synchronization in your code by running the Locks and Waits analysis of the Intel® VTune™ Amplifier with the task collection enabled.
Content expert: Kirill Uhanov
DIRECTIONS:
Locks and Waits analysis was renamed to Threading analysis starting with Intel VTune Amplifier 2019.
Ingredients
Application: client and server applications with TCP socket communications
Performance analysis tools: Intel VTune Amplifier 2018 > Locks and Waits analysis
NOTE:Starting with the 2020 release, Intel® VTune™ Amplifier has been renamed to Intel® VTune™ Profiler.
Most recipes in the Intel® VTune™ Profiler Performance Analysis Cookbook are flexible. You can apply them to different versions of Intel® VTune™ Profiler. In some cases, minor adjustments may be required.
Get the latest version of Intel® VTune™ Profiler:
From the Intel® VTune™ Profiler product page.
Download the latest standalone package from the Intel® oneAPI standalone components page.
Client operating system: Microsoft* Windows* Server 2016
Server operating system: Linux*
Run Locks and Waits Analysis
If you see your client application take much time to warm up, consider running the Locks and Waits analysis to explore wait statistics per synchronisation object:
Click the New Project toolbar button to create a new project, for example: tcpip_delays.
In the Analysis Target window, select the local host target system type for the host-based analysis.
Select the Launch Application target type and specify an application for analysis on the right.
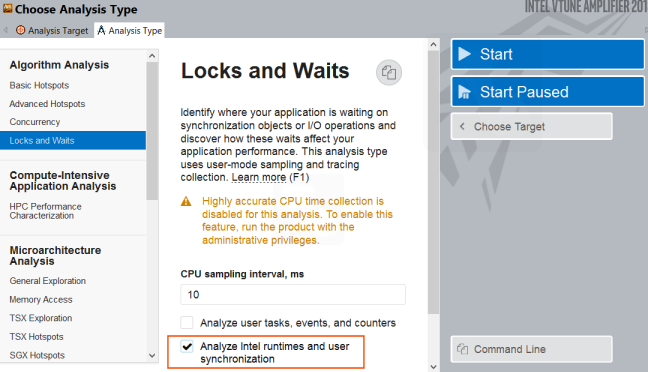
Click the Choose Analysis button on the right, select Algorithm Analysis > Locks and Waits.
- Click Start.
VTune Amplifier launches the application, collects data and finalizes the data collection result resolving symbol information, which is required for successful source analysis.
Locate Synchronization Delays on the Timeline
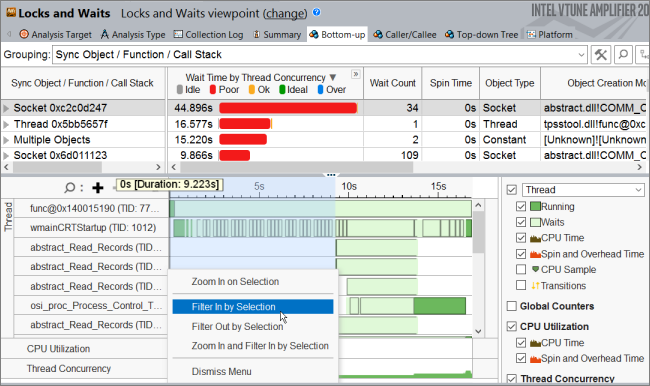
Open the collected result and click the Bottom-up tab to view performance details per synchronization object. On the Timeline pane, you see multiple synchronization delays when the test application starts executing. To identify synchronization objects causing these startup delays, drag-and-drop to select the first 9 seconds and use the Filter In by Selection option from the context menu:
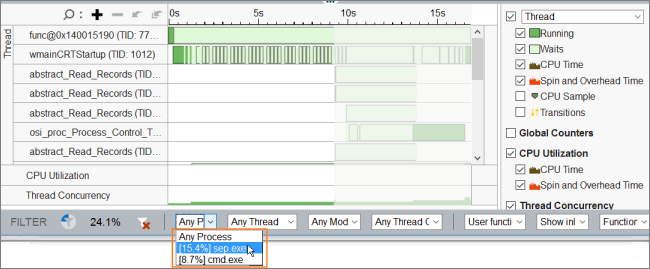
Use the Process menu on the filter bar to filter in by the host communication process:
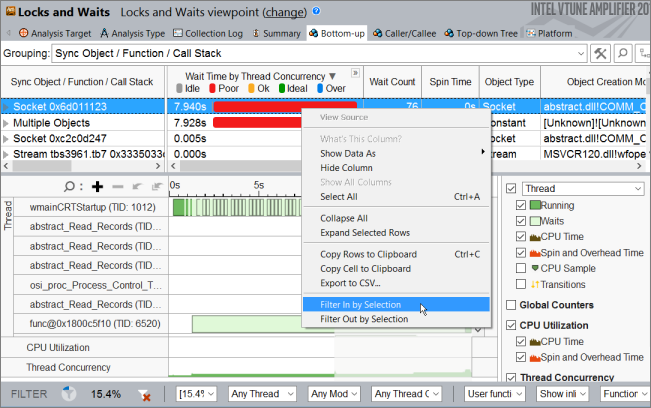
Now, for this selected time frame, select the Socket synchronization object that generated the highest number of waits and use the Filter In by Selection menu option to filter in the data:
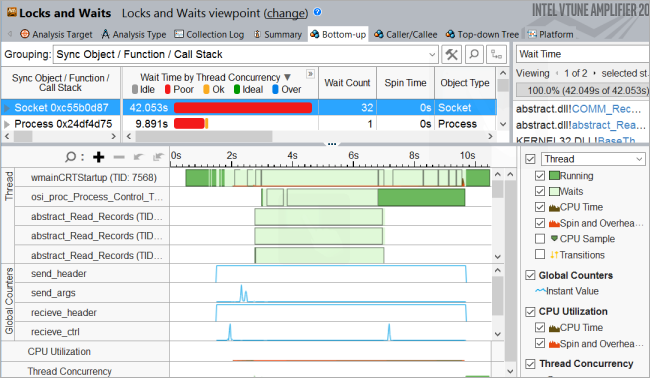
To investigate Wait time for the Socket synchronization object, focus on the timeline:
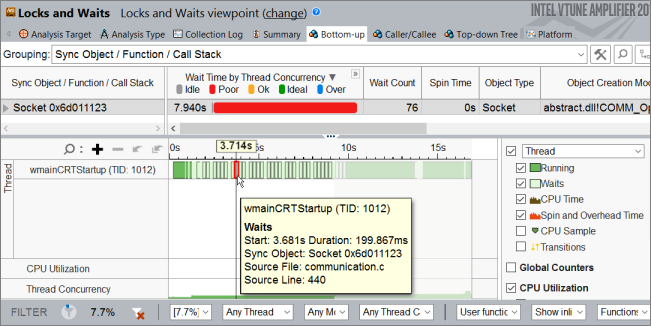
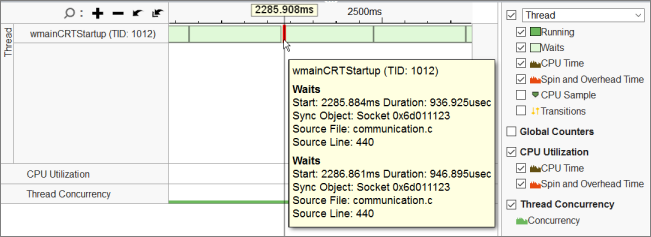
If you click the  Zoom In button, you can see two types of socket waits: fast and slow. Most of the slow sockets waits are about 200 ms, while fast waits last about 937 usec:
To understand the cause of fast and slow waits, wrap all send/receive calls by ITT counters to calculate send/receive bytes.
Detect send/receive Buffer Size with ITT API Counters
To use Instrumentation and Tracing Technology (ITT) APIs for tracing send/receive calls:
- Configure your system to be able to reach the API headers and libraries.
Include the ITT API header to your source file and link the <vtune-install-dir>\[lib64 or lib32]\libittnotify.lib static library to your application.
Wrap send/receive calls with ITT counters:
#include <ittnotify.h>

__itt_domain* g_domain =__itt_domain_createA("com.intel.vtune.tests.userapi_counters");
__itt_counter g_sendCounter = __itt_counter_create_typedA("send_header", g_domain->nameA, __itt_metadata_s32);
__itt_counter g_sendCounterArgs = __itt_counter_create_typedA("send_args", g_domain->nameA, __itt_metadata_s32);
__itt_counter g_recieveCounter = __itt_counter_create_typedA("recieve_header", g_domain->nameA, __itt_metadata_s32);
__itt_counter g_recieveCounterCtrl = __itt_counter_create_typedA("recieve_ctrl", g_domain->nameA, __itt_metadata_s32);
__itt_counter g_incDecCounter = __itt_counter_createA("inc_dec_counter", g_domain->nameA);

.....

    sent_bytes = send(...);
    __itt_counter_set_value(g_sendCounter, &sent_bytes);
.....
    sent_bytes = send(...);
    __itt_counter_set_value(g_sendCounterArgs, &sent_bytes);
.....
    while(data_transferred < header_size)) {
        if ((data_size = recv(...) < 0) {
                               .....
    }
    __itt_counter_set_value(g_recieveCounter, &data_transferred);
.....

        while(data_transferred < data_size) {
            if ((data_size = recv(...) < 0) {
                                               ....
                                               }
        }
    }
    __itt_counter_set_value(g_recieveCounterCtrl, &data_transferred);
Recompile your application and re-run the Locks and Waits analysis with the Analyze user tasks, events, and counters option enabled:
Identify the Cause of Inefficient TCP/IP Synchronization
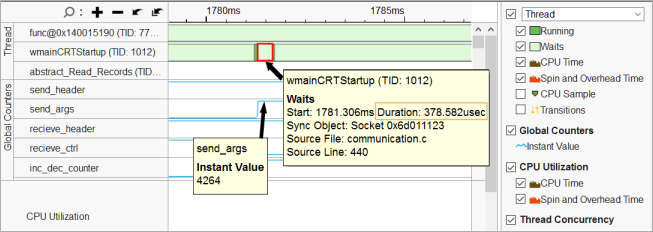
You see that for the new result, the VTune Amplifier added the Global Counters section to the Timeline pane that shows the distribution of the send/receive calls collected via ITT API. When you mouse over waits on the threads and counter values, you see that small instant values of the counters correspond to the long (slow) waits:
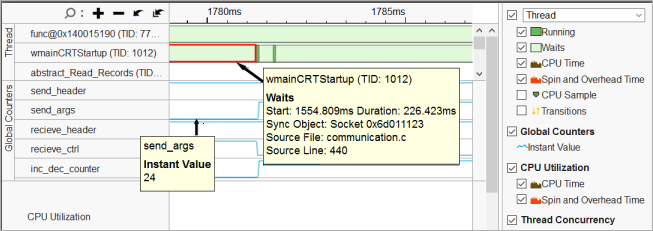
And fairly high counter values correspond to the short (fast) waits:
Profiling of communication waits on the remote target provides a symmetric picture: when you receive a small-size buffer, you have a long wait; and when you receive a sufficient buffer, you have a fast wait.
In this recipe, you see a communication command channel. Most of the commands have a small size, which results in a significant count of long waits.
The cause of the issue is the tcp ack delay mechanism that adds waits for small buffers.
If you decrease an input (setsockopt (…, SO_RCVBUF, ..,)) buffer on the server side, you can get more than 5x startup time speed-up (from dozens to a couple seconds):