Profiling Applications in Amazon Web Services* (AWS) EC2 Instances
This recipe helps you set up a VM instance in AWS for performance profiling with Intel® VTune™ Profiler.
Content expert: Denis Pravdin, Jennifer Dimatteo
Ingredients
This section lists the hardware and software tools used for the performance analysis scenario.
Application:matrix. The application is used as a demo and not available for download.
Tools: Intel® VTune™ Profiler 2020 - Hotspots analysis
NOTE:Starting with the 2020 release, Intel® VTune™ Amplifier has been renamed to Intel® VTune™ Profiler.
Most recipes in the Intel® VTune™ Profiler Performance Analysis Cookbook are flexible. You can apply them to different versions of Intel® VTune™ Profiler. In some cases, minor adjustments may be required.
Get the latest version of Intel® VTune™ Profiler:
From the Intel® VTune™ Profiler product page.
Download the latest standalone package from the Intel® oneAPI standalone components page.
Create and Configure a Virtual Machine Instance
On the Amazon Web Services site, click Sign In to the Console to log in to your account.
If you do not have an account, create it.
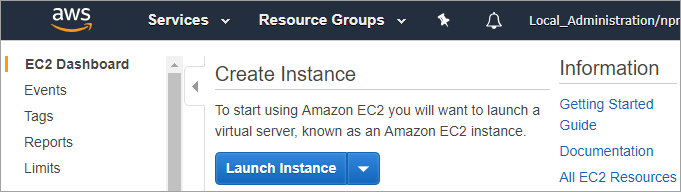
Enter the Amazon EC2 Dashboard, select Compute > EC2.
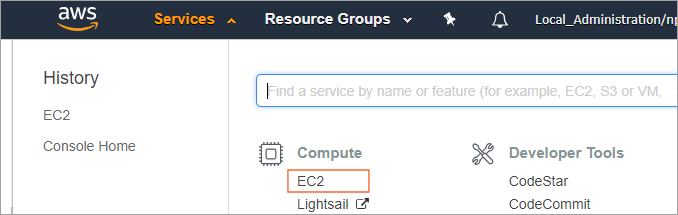
Click Launch Instance to create and configure your virtual machine with a wizard.
In the configuration wizard, you can specify an OS and specification of the instance that fits your case (number of CPUs, memory, storage, and networking capacity).
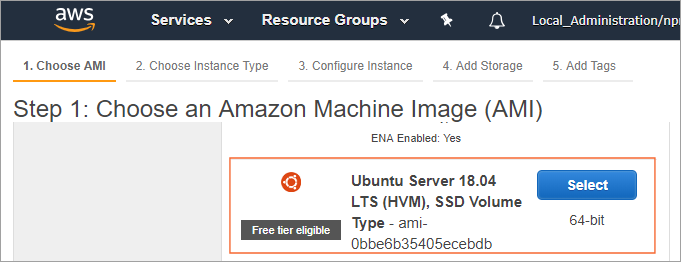
In Step 1: Choose an Amazon Machine Image (AMI), select Ubuntu Server 18.04 LTSlick.
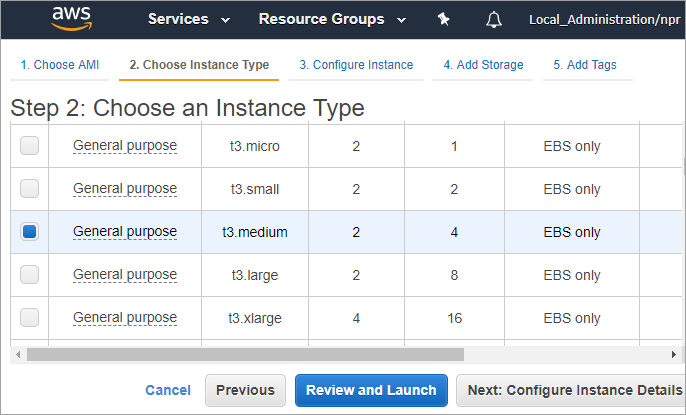
In Step 2: Choose an Instance Type, select an instance and click Next: Configure Instance Details.
 NOTE:
NOTE:Recommended system requirements for the VTune Profiler is 4 GB of RAM and at least 10Gb free disk space.
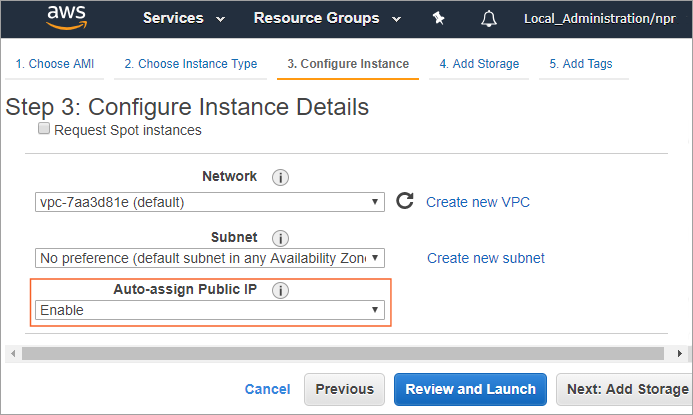
In Step 3: Configure Instance Details, enable Auto-assign Public IP and click Next: Add Storage.
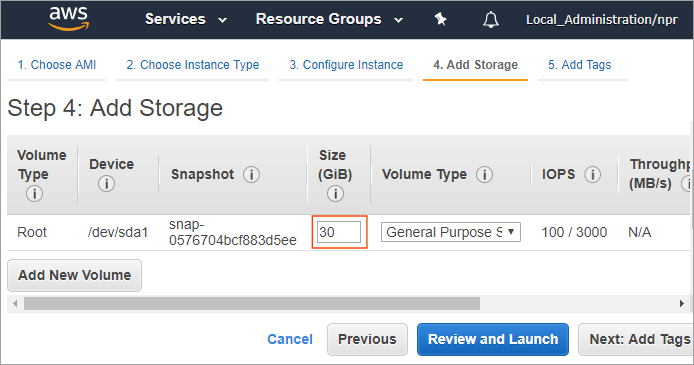
In Step 4: Add Storage, increase the size of the storage device and click Next: Add Tags.
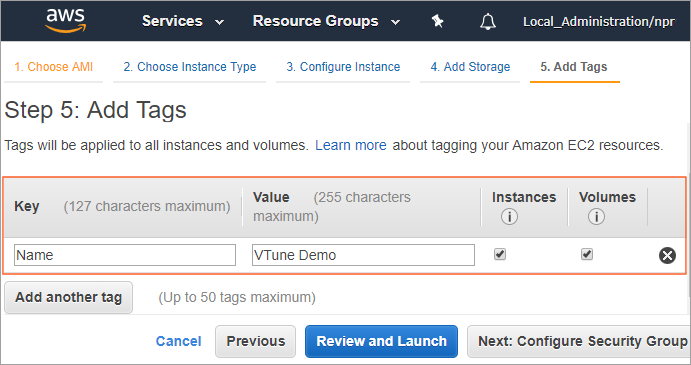
[Optional] In Step 5: Add Tags, add a tag (for example, VTune Demo), then click Review and Launch.
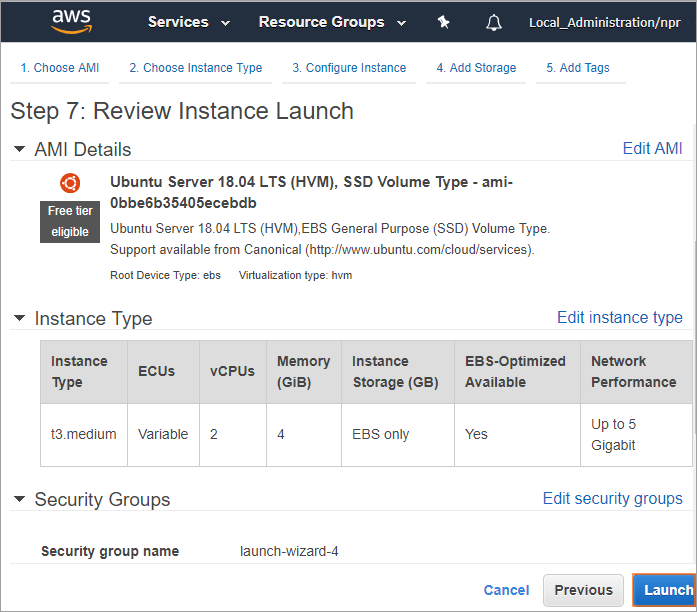
In Step 7: Review Instance Launch, click Launch.
Create a key pair:
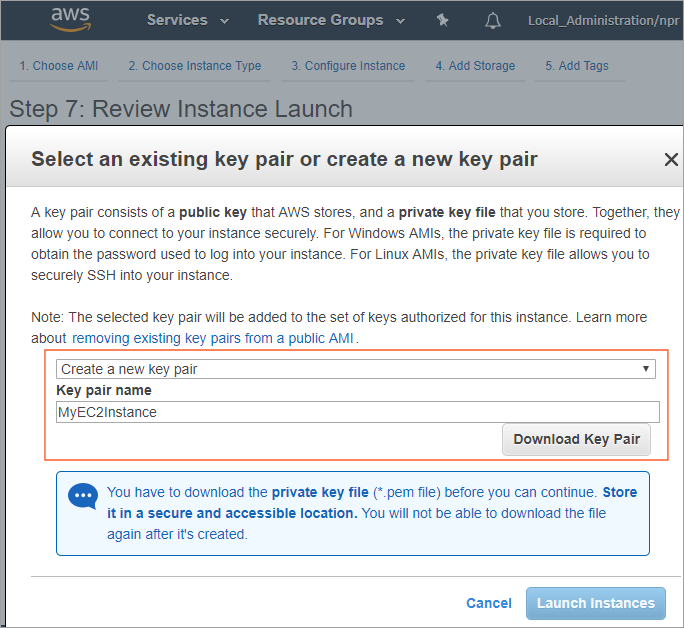
Select Create a new key pair and assign a name (for example, MyEC2Instance).
Click Download Key Pair to download the key.
Select Launch Instances to complete the setup.
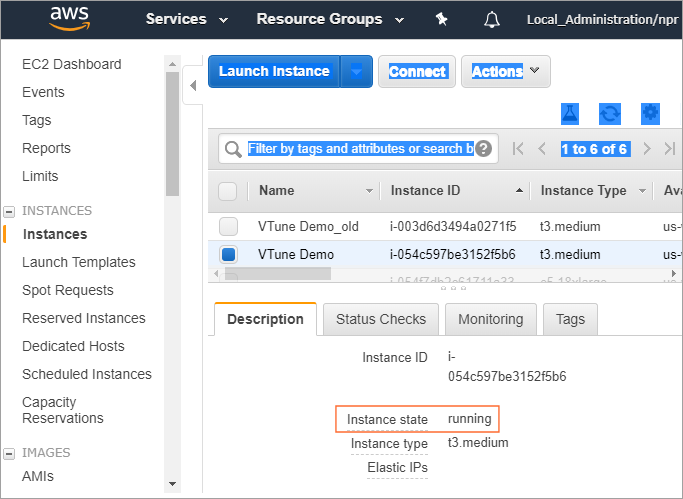
The instance is launched.
Click View Instances.
When the Instance State is updated to running, proceed to the next step.
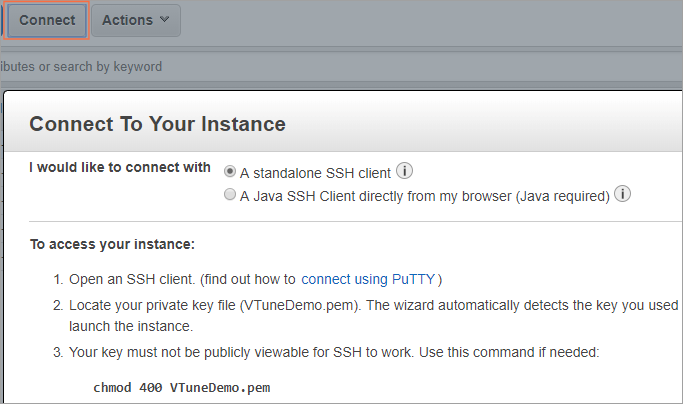
Connect to the EC 2 Instance
Select the EC2 instance you created and click the Connect tab to connect to your instance via SSH.
PuTTY* does not natively support the private key format (.pem) generated by Amazon EC2. You should convert your private key (.pem) to the required PuTTY format (.ppk) using PuTTYgen before attempting to connect to your instance using PuTTY:
Convert your private key:
Start PuTTYgen.
For the Type of key to generate, select SSH-1 (RSA).
Click Load and select your .pem file.
Click Save private key to save the key in the format that PuTTY can use.
Start PuTTY and specify a Public DNS for the instance and your private key (.ppk) file in the Connection > SSH > Auth pane.
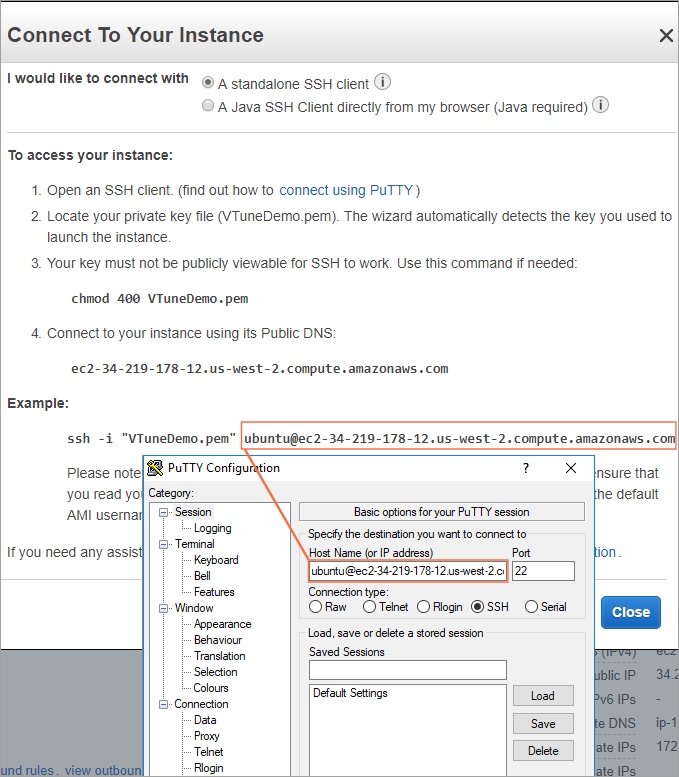
Save this configuration and click Open.
You are logged in to the instance.
You need to install the Xubuntu* desktop on your running instance and setup a VNC* Server if you want to access the system via VNC.
Configure the Instance for Profiling
Prepare the target instance for profiling by setting /proc/sys/kernel/yama/ptrace_scope to 0:
echo 0 | sudo tee /proc/sys/kernel/yama/ptrace_scope
Run Hotspots Analysis
Run the Hotspots analysis using any of the following methods:
Run a remote collection from the locally installed VTune Profiler using SSH:
Remote hardware event-based sampling analysis is not available in the AWS EC2 virtualized environment with an exception for the EC2 bare metal instances (i3.metal instance family) that allow direct access to bare metal infrastructure and full profiling capability of the VTune Profiler.
Create a project in the VTune Profiler.
The Configure Analysis window opens.
In the WHERE pane, select Remote Linux (SSH) and enter ubuntu@<name of putty configuration> for the SSH destination.
At this point, VTune Profiler attempts to connect to the remote system and install the binaries necessary for collection to the specified folder.
In the WHAT pane, specify the location of your application and its working directory.
In the HOW pane, select the User-Mode Sampling collection mode for the Hotspots analysis (open by default).
Click
 to start the collection.
 The results are automatically copied to your local system for analysis.
Run VTune Profiler directly from the AWS instance:
Install the VTune Profiler as described in the Installation Guide.
Run the VTune Profiler. For example:
sudo <vtune_install_dir>/vtune_profiler/bin64/vtune-gui
Create a project.
The Configure Analysis window opens.
In the WHERE pane, select Local Host.
In the WHAT pane, specify the location of your application and its working directory.
In the HOW pane, select a preferred collection mode for the Hotspots analysis, for example: Hardware Event-Based Sampling.
Click
to start the collection. The analysis result opens in the default Hotspots by CPU Utilization viewpoint.