2.1. Parsing Programming Files
2.2. Getting Device Information
2.3. Debugging QSPI Flash
2.4. QSPI Controller Settings and SFDP Values
2.5. Debugging Remote System Update
2.6. Voltage Sensor Monitoring
2.7. Temperature Sensor Monitoring
2.8. Hard Processor System (HPS) Cold Reset
2.9. Debug Log
2.10. SDM Mailbox Command
2.11. VR Diagnostic
2.12. VR Telemetry
2.13. Virtual Hardware
2.13.2.1. Reading Programming File Information from Virtual Hardware
2.13.2.2. Reading Device Information from Virtual Hardware
2.13.2.3. Accessing Flash Memory Attached to Virtual Hardware
2.13.2.4. Performing RSU with Virtual Hardware
2.13.2.5. Reading Voltage Sensor Measurement from Virtual Hardware
2.13.2.6. Reading Temperature Sensor Measurement from Virtual Hardware
2.13.2.7. Sending SDM Mailbox Commands with Virtual Hardware
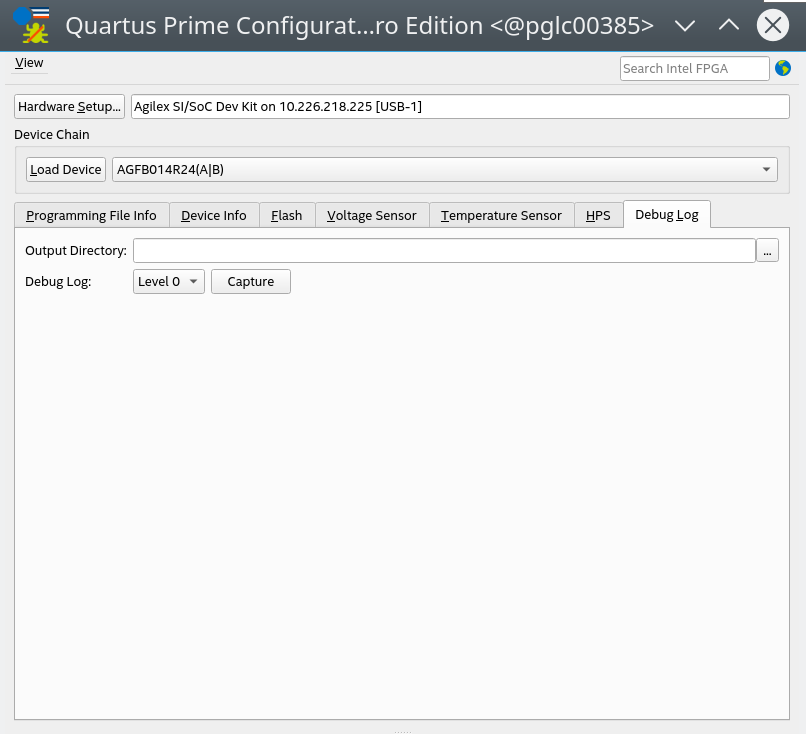
2.9.1. Getting the Debug Log
- Click Hardware Setup to select the hardware setup to use for debugging.
- Click Load Device and select your device.
- Click Debug Log
Note: The Debug Log tab is disabled if the selected device is not SDM-based.
- Choose the Output Directory to save the debug log file.
- Select the debug level from the drop-down list of supported debug level.
- Click Capture to capture the debug log to a text file.
Figure 13. Debug Log