2.1. Parsing Programming Files
2.2. Getting Device Information
2.3. Debugging QSPI Flash
2.4. QSPI Controller Settings and SFDP Values
2.5. Debugging Remote System Update
2.6. Voltage Sensor Monitoring
2.7. Temperature Sensor Monitoring
2.8. Hard Processor System (HPS) Cold Reset
2.9. Debug Log
2.10. SDM Mailbox Command
2.11. VR Diagnostic
2.12. VR Telemetry
2.13. Virtual Hardware
2.13.2.1. Reading Programming File Information from Virtual Hardware
2.13.2.2. Reading Device Information from Virtual Hardware
2.13.2.3. Accessing Flash Memory Attached to Virtual Hardware
2.13.2.4. Performing RSU with Virtual Hardware
2.13.2.5. Reading Voltage Sensor Measurement from Virtual Hardware
2.13.2.6. Reading Temperature Sensor Measurement from Virtual Hardware
2.13.2.7. Sending SDM Mailbox Commands with Virtual Hardware
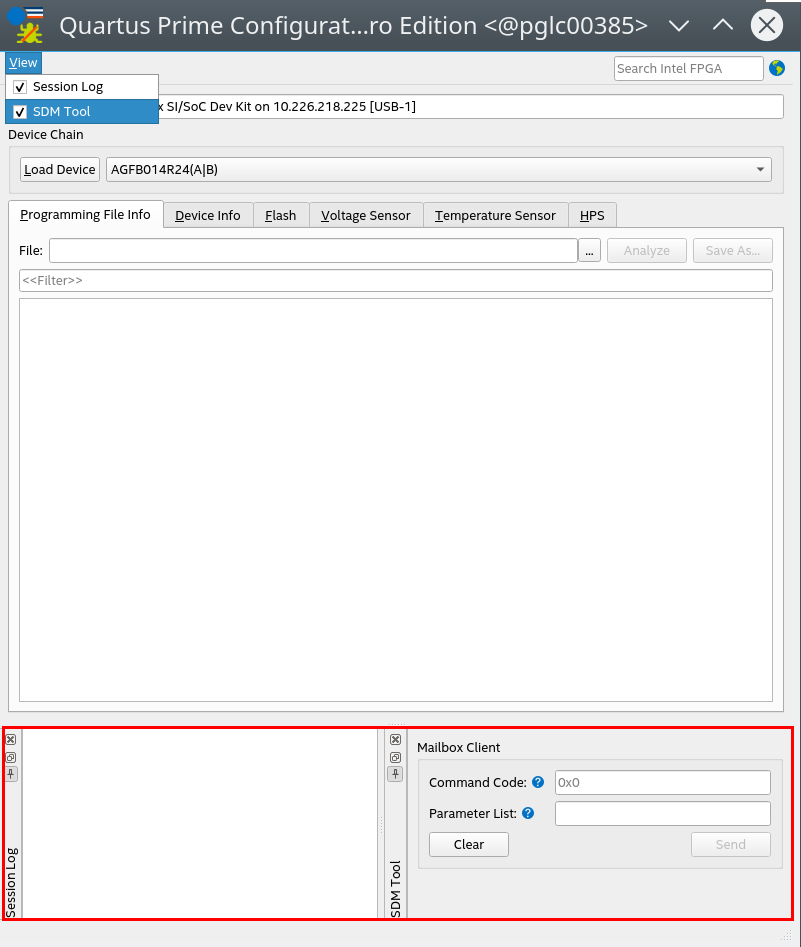
2.10.1. Sending SDM Mailbox Command
- Click Hardware Setup to select the hardware setup to use for debugging.
- Click Load Device and select your device.
- Click View and select SDM Tool to enable the Mailbox Client window.
Note: The SDM Tool window is disabled if the selected device is not SDM-based.
- Specify Command Code for SDM Mailbox Command Code and Parameter List for SDM Mailbox Command Parameter.
Note: Refer to Mailbox Client IP User Guide for SDM Mailbox Command code.
- Click Send to send the SDM Mailbox command. The response is displayed in the session log.
Figure 14. Sending SDM Mailbox Command
Related Information