A newer version of this document is available. Customers should click here to go to the newest version.
Tabs
Properties tab: Displays information about a selected graph in the Graph tab, a node in the Node tab, and an edge in the Edge tab.
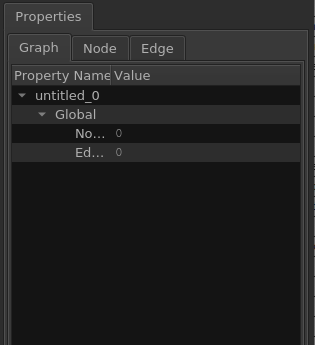
The Node tab displays all properties supported for a given node type and allows you to interactively edit them. Some properties might be tied to the node type and are marked as read-only. See the Designer Workflow section for instructions on editing the properties of a node.
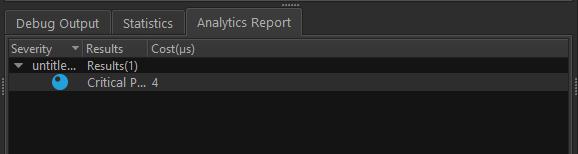
Analytics Report tab: Displays the output generated by any invoked analytics algorithms. Because analytics algorithms generate different outputs, this view changes when depending on an algorithm you run on the graph. The screenshot below shows a sample output for Compute Critical Path. The columns in this tab are sortable and enable efficient data manipulation during the performance tuning workflow.
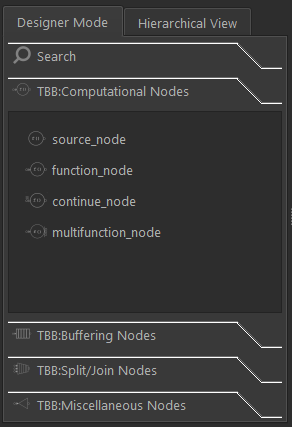
Designer Mode tab: Shows the available node types you can use to construct a graph. This tab might change when new nodes are added to a Intel® oneAPI Threading Building Blocks (oneTBB) flow graph interface. For more information about each node type, use the What’s This? functionality on the node-type buttons.
After you select a node type to insert into the graph, the mouse cursor takes the shape of the selected node type. You may add as many nodes of the same type as you want to by placing the cursor at a location on the canvas and clicking a mouse. To switch to a different node type, select the node type of interest in the tab.
To exit the Insert Node mode, press the ESC key if the mouse is placed in the canvas area, or select the Insert Edge or Move Node modes from the Toolbar menu.
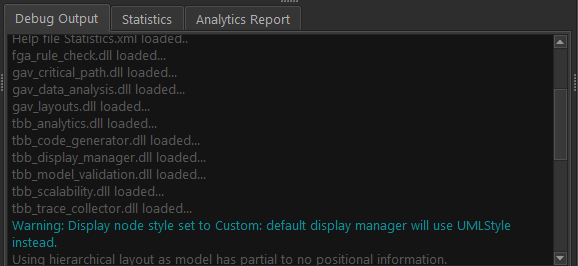
Debug Output tab: Displays messages output by the tool. Most of the messages are informational, but warning or error messages may appear. Warning messages are green, and Error messages are yellow.
Source View tab: Displays the source mapping of a selected node if symbol resolution information has been captured during the collection.
NOTE:Currently, this feature is only supported on Linux* OS. To enable data collection with symbol resolution information, please refer to Building on a Linux* Operating System and Collecting Trace Files with an fgtrun.sh Script.