A newer version of this document is available. Customers should click here to go to the newest version.
Flow Graph Analyzer GUI Overview
This section describes the Flow Graph Analyzer tool and the various features it offers to speed up the development of new flow graph applications. There are two main tools represented by corresponding workflows:
A designer workflow enhances productivity during development.
An analyzer workflow supports performance-tuning tasks.
Basic GUI Layout
The Flow Graph Analyzer GUI allows you to create new graphs visually and load previously created or application-generated graphs.
The following figure describes the basic GUI layout and the key elements necessary for constructing graphs visually. These graphs can be saved for later use and, as described in the Generating C++ Stubs section, used to generate C++ framework code.
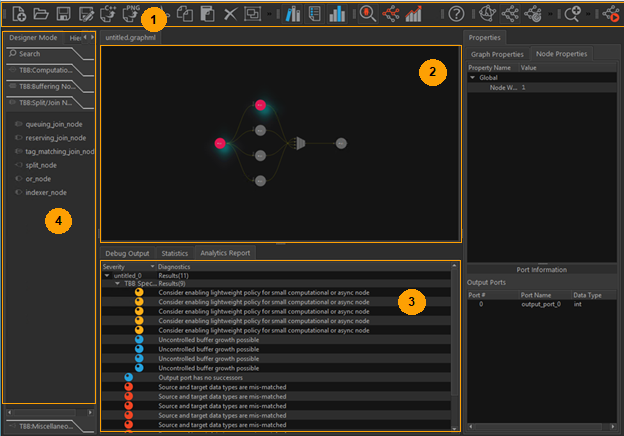
1 |
Toolbar supporting basic file and editing operations, visualization and analytics that operate on the graph or performance traces. |
2 |
Canvas for visualizing and drawing flow graphs. |
3 |
Output generated by custom analytics. You can interact with the output. |
4 |
Palette of supported Intel® oneAPI Threading Building Blocks node types organized in groups. |
GUI Layout with Trace Data
When analyzing an existing application’s performance, the graph topology and performance data are captured from a running application and saved for a post-mortem analysis. If performance traces are available when the graph is loaded, they are displayed in a timeline window below the canvas area. You can interact with the trace data in many ways, from cursory inspection of the trace data to detailed inspection of specific tasks and the nodes they map to. The following figure shows the timeline charts created when trace data is available.
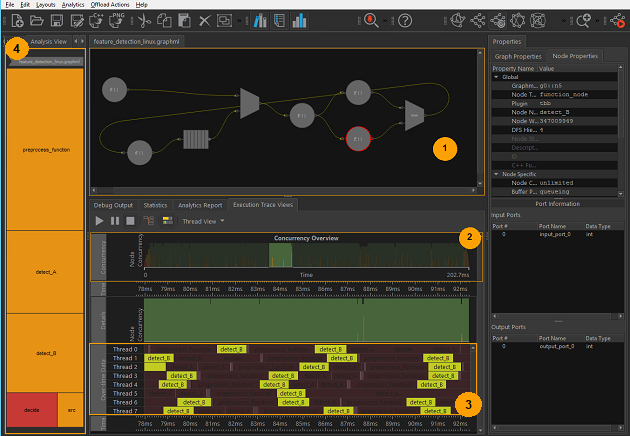
1 |
Selection on the timeline highlights the nodes executing at that point in time. |
2 |
The concurrency histogram shows the parallelism achieved by the graph over time. You can interact with this chart by zooming in to a region of time, for example, during low concurrency. The concurrency histogram remains at the initial zoom level, and the zoomed-in region is displayed below it. |
3 |
The per-thread task view shows the tasks executed by each thread, along with the task durations. |
4 |
Treemap view provides the general health of the graph’s performance, along with the ability to dive to the node level. |