A newer version of this document is available. Customers should click here to go to the newest version.
Offload Modeling Report Overview
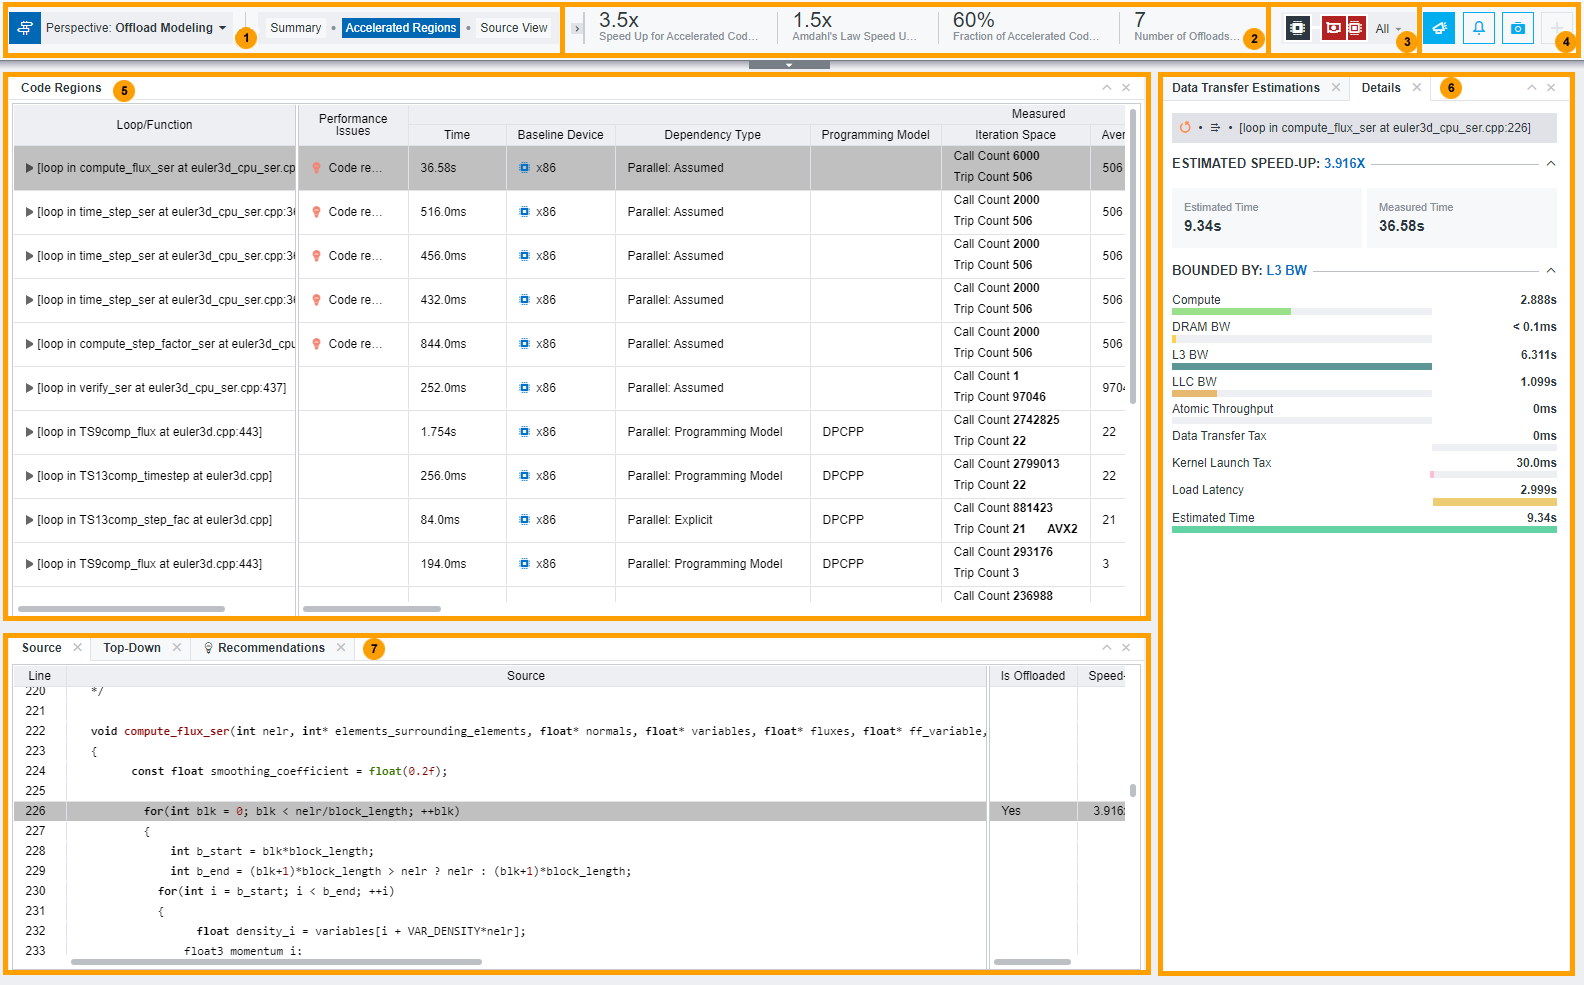
Review the controls available in the main report of the Offload Modeling perspective. You can view the interactive HTML report or a graphical user interface.
In the Accelerated Regions and Summary reports, you can drag and drop, close/open, collapse/expand panes to change the report layout.
|
Switch between perspectives or different Offload Modeling report tabs. |
|
Review the summary of estimated offload characteristics for your application. The pane highlights total speedup, number of loops and functions offloaded, and a fraction of code accelerated. |
|
Select code regions to show in the report based on offload type:
|
|
|
|
Review application performance measured on a host platform and its performance modeled on a target platform. For details about metrics reported, see Accelerator Metrics. Depending on a perspective configuration and accuracy level, you might see different metrics reported and some metrics might be not accurate. Refer to the following topics for interpretation details:
|
|
Switch between Data Transfer Estimations and Details tabs for more information about loops selected in Code Regions:
|
|
Switch between Source and Top-Down tabs for more information about loops selected in Code Regions:
|


 button to show per-program recommendations, which you can collapse/expand.
  button to see the collection log including featured events separated by analyses, full collection log, and application output.

