A newer version of this document is available. Customers should click here to go to the newest version.
Design and Optimization Methodology
Intel® Advisor helps you to design and optimize high-performing Fortran, C, C++, SYCL, OpenMP*, and OpenCL™ code to realize full performance potential on modern computer architecture. You can measure your application performance, collect required data, and look at your code from different perspectives depending on your goal to dig deeper and get hints for optimization.
Visualize Performance Bottlenecks with Roofline Chart
When optimizing your C, C++, SYCL, or Fortran application, it is useful to know application's current and potential performance in relation to hardware-imposed limitations like memory bandwidth and compute capacity of a target platform that it runs on - a CPU or a GPU.
Roofline model of the Intel Advisor visualizes actual performance against hardware-imposed performance ceilings and helps you determine the main limiting factor (memory bandwidth or compute capacity) to provide an ideal road map of potential optimization steps. This analysis highlights loops that have the most headroom for improvement, which allows you to focus on areas that deliver the biggest performance payoff.
To generate a Roofline report, the Intel Advisor:
- Collects loop/function (for CPU) or OpenCL™ kernels (for GPU) timings and memory data.
- Measures the hardware limitations and collects floating-point and integer operations data.
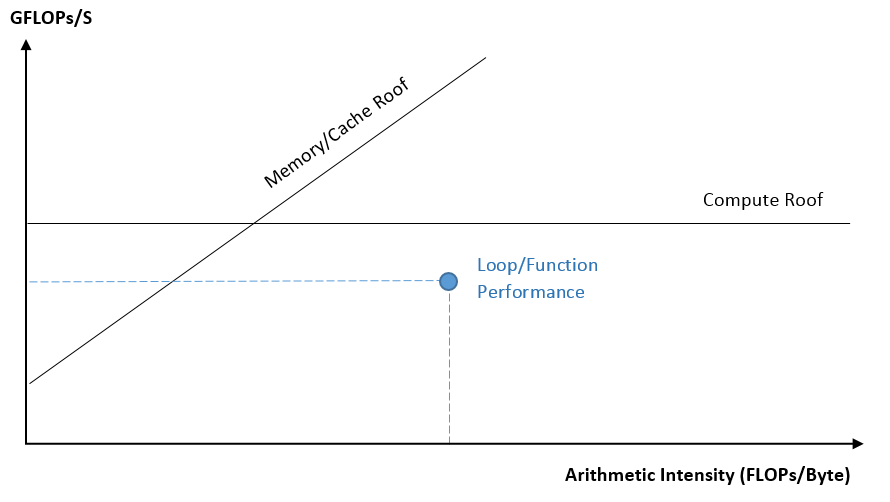
The Roofline chart plots an application achieved performance and arithmetic intensity against the hardware maximum achievable performance:
- Arithmetic intensity (x axis) - measured in number of floating-point operations (FLOPs) and/or integer operations (INTOPs) per byte, based on the loop/function algorithm, transferred between CPU/VPU/GPU and memory.
- Performance (y axis) - measured in billions of floating-point operations per second (GFLOPS) and/or billions of integer operations per second (GINTOPS).
With the data collected, the Intel Advisor plots the Roofline chart:
- Execution time of each loop/function/kernel is reflected in the size and color of each dot. The dots on the chart correspond to OpenCL kernels for GPU Roofline, while for the CPU Roofline, they correspond to individual loops/functions.
- Memory bandwidth limitations are plotted as diagonal lines.
- Compute capacity limitations are plotted as horizontal lines.
For details on how to get the Roofline report and read the results, see CPU / Memory Roofline Insights Perspective or GPU Roofline Insights Perspective.
Model Offloading to Accelerator
When designing your application to offload to an accelerator, you might first want to:
Estimate the offload benefit and overhead for each loop/function in your original C++ or Fortran code to make better decisions on which parts of code to offload
Check performance gain for a SYCL , OpenCL™, or OpenMP* target application if you offload it to a different accelerator
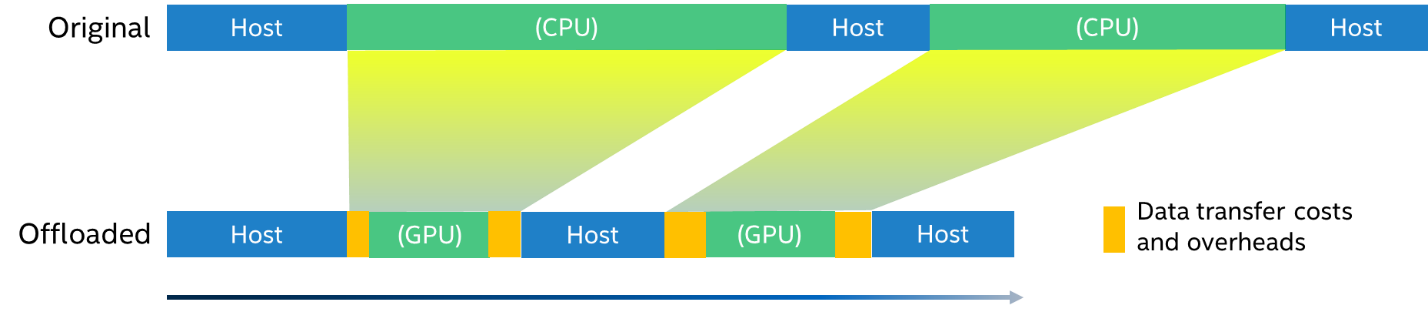
Offload Modeling perspective of the Intel® Advisor can identify high-impact portions of a code that are profitable to offload to a target platform (for example, to a GPU) as well as the code regions that are not advantageous to offload. It can also predict the code performance if run on the target platform and lets you experiment with accelerator configuration parameters.
Offload Modeling takes measured baseline metrics and application characteristics as an input and applies an analytical model to estimate execution time and characteristics on a target platform.
Offload Modeling is based on three models:
- Compute throughput model counts arithmetic operations in a region on a baseline platform and estimates the execution time on a target platform required to achieve the same mix of arithmetic operations, considering it as bound by compute engines only.
- Memory sub-system throughput model traces memory accesses inside a region on a baseline platform and estimates the execution time on a target platform needed to transfer the same amount of memory. Memory traffic is measured using a cache simulator that reflects the target platform's memory configuration.
- Offload data transfer analysis measures memory accesses that are read from or written to a region and will need to be sent over a PCIe* if the region is offloaded to a target platform.
For details on how to run the Offload Modeling perspective and read the reports, see Offload Modeling Perspective.
Check Vectorization Efficiency
Modern Intel® processors have extensions that support SIMD (single instruction, multiple data) parallelism with Intel® Streaming SIMD Extensions (Intel® SSE), Intel® Advanced Vector Extensions 2 (Intel® AVX2), Intel® Advanced Vector Extensions 512 (Intel® AVX-512) . To take advantage of SIMD instructions with the expanded vector width and achieve higher performance, applications need to be vectorized.
You can rely on your desired compiler - Intel® C++ Compiler Classic, Intel® Fortran Compiler Classic, Intel® oneAPI DPC++/C++ Compiler, GNU Compiler Collection (GCC)* - to auto-vectorize some loops, but serial constraints of programming languages limit the compiler's ability to vectorize some loops. The need arose for explicit vector programming methods to extend vectorization capability for supporting reductions, vectorizing:
- Outer loops
- Loops with user-defined functions
- Loops that the compiler assumes to have data dependencies
To improve the performance of CPU-bound applications on modern processors with vector processing units, you might use explicit vector programming apply structural changes for thread-level parallelism and SIMD-level parallelism.
Use the Vectorization and Code Insights perspective of the Intel Advisor to analyze your application run time behavior and identify application parts that will benefit most from vectorization. Vectorization and Code Insights perspective helps you to achieve the best performance using vectorization and identify:
- Where vectorization, or parallelization with threads, will pay off the most
- If vectorized loops are providing benefit, and if not, why not
- Un-vectorized loops and why they are not vectorized
- Performance problems in general
For details on how to run the perspective and read the reports, see Vectorization and Code Insights Perspective.
Prototype Threading Designs
The best performance improvements from adding parallel execution (parallelism) to a program occur when many cores are busy most of the time doing useful work. Achieving this requires a lot of analysis, knowledge, and testing.
Because your serial program was not designed to allow parallel execution, as you convert parts of it to use parallel execution, you may encounter unexpected errors that occur only during parallel execution. Instead of wasting effort on portions of the program that use almost no CPU time, you should focus on the hotspots, and the functions between the main entry point and each hotspot.
If you add parallel execution to a program without proper preparation, unpredictable crashes, program hangs, and wrong answers can result from incorrect parallel task interactions. For example, you may need to add synchronization to avoid incorrect parallel task interactions, but this must be done carefully because locking overhead and serial synchronization can reduce the benefits of the parallel execution.
Threading perspective of the Intel Advisor helps you quickly prototype multiple threading options, project scaling on larger systems, optimize faster, and implement with confidence.
- Identify issues and fix them before implementing parallelism
- Add threading to C, C++, and Fortran code
- Prototype the performance impact of different threaded designs and project scaling on systems with larger core counts without disrupting development or implementation
- Find and eliminate data-sharing issues during design (when they're less expensive to fix)
The high-level parallel frameworks available for each programming language include:
Language |
Available High-Level Parallel Frameworks |
|---|---|
C |
OpenMP |
C++ |
Intel® oneAPI Threading Building Blocks (oneTBB) OpenMP |
Fortran |
OpenMP |
For details on how to run the perspective and read the reports, see Threading Perspective.
Using Amdahl's Law and Measuring the Program
There are two rules of optimization that apply to parallel programming:
Focus on the part of the program that uses the most time.
Do not guess, measure.
Amdahl's Law
In the context of parallel programming, Gene Amdahl formalized a rule called Amdahl's Law, which states that the speed-up that is possible from parallelizing one part of a program is limited by the portion of the program that still runs serially.
The consequence may be surprising: parallelizing the part of your program where it spends 80% of its time cannot speed it up by more than a factor of five, no matter how many cores you run it on.
Therefore, to get maximum benefit from parallelizing your program, you could add parallelism to all parts of your program as suggested by Amdahl's Law. However, it is more practical to find where it spends most of its time and focus on areas that can provide the most benefit.
Do Not Guess - Measure
This leads to another rule of optimization: Do Not guess - Measure. Programmers' intuitions about where their programs are spending time are notoriously inaccurate. Intel® Advisor includes a Survey tool you can use to profile your running program and measure where it spends it time.
After you add Intel® Advisor annotations to your program to mark the proposed parallel code regions, run the Suitability tool to predict the approximate maximum performance gain for the program and the annotated sites. These estimated performance gain values are based on a model of parallel execution that reflects the impact of Amdahl's law.