A newer version of this document is available. Customers should click here to go to the newest version.
Explore CPU/Memory Roofline Results
Intel® Advisor provides several ways to view the CPU / Memory Roofline Insights results.
View Results in GUI
If you run the CPU / Memory Roofline Insights perspective from command line, a project is created automatically in the directory specified with --project-dir. All the collected results and analysis configurations are stored in the .advixeproj project, which you can view in the Intel Advisor.
To open the project in GUI, run the following command:
advisor-gui <project-dir>
If you run the CPU / Memory Roofline Insights perspective from GUI, the result is opened automatically after the collection finishes.
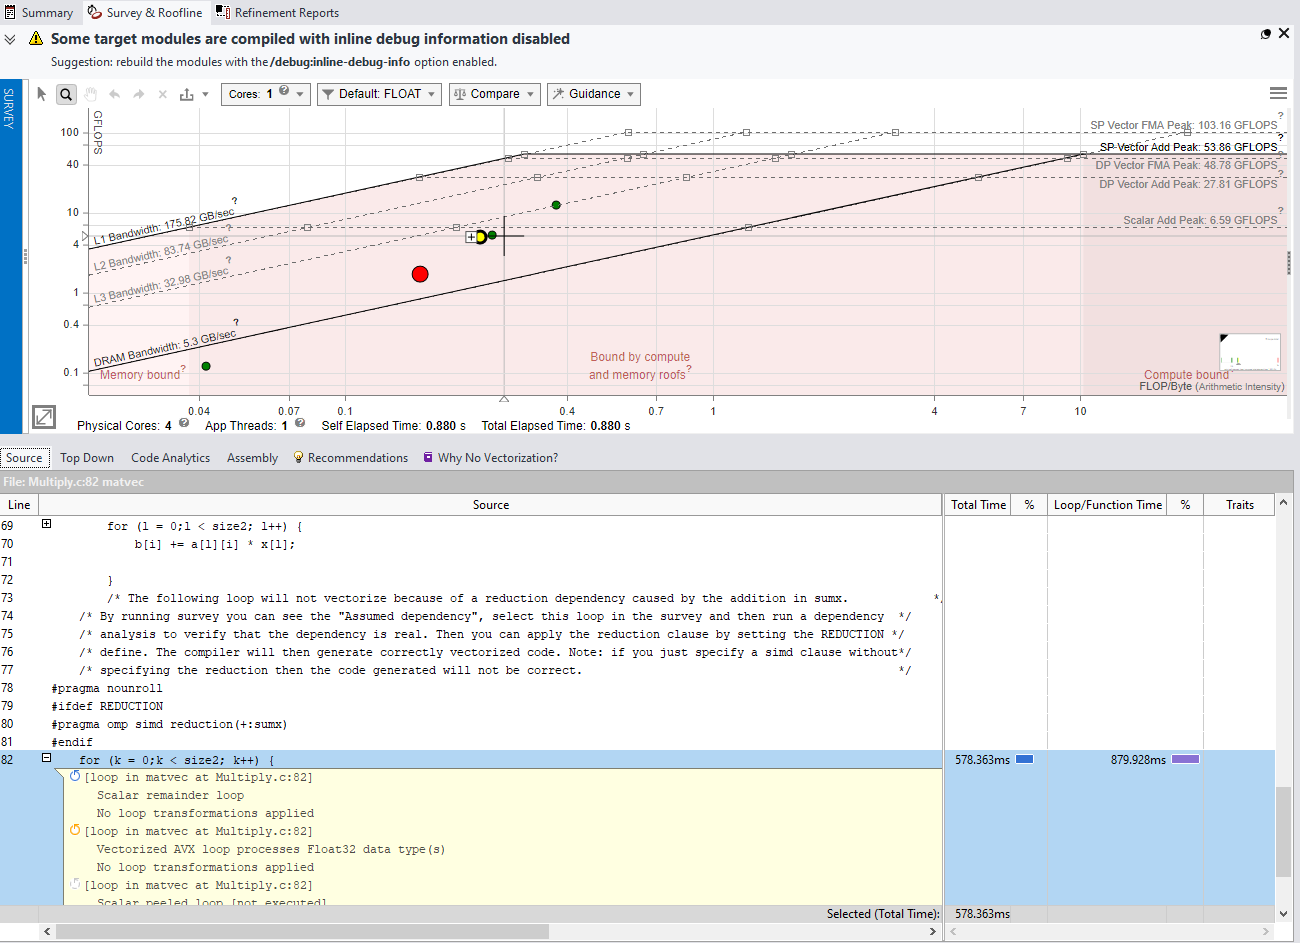
You will see the CPU Roofline report that includes:
Roofline chart that plots an application's achieved performance and arithmetic intensity against the CPU maximum achievable performance
Additional information about your application in the Advanced View pane under the chart, including source code, detailed code analytics for trip counts and FLOP/INTOP data, optimization recommendations, and compiler diagnostics
Select a dot on the Roofline chart to see details for the selected loop in all tabs of the Advanced View pane
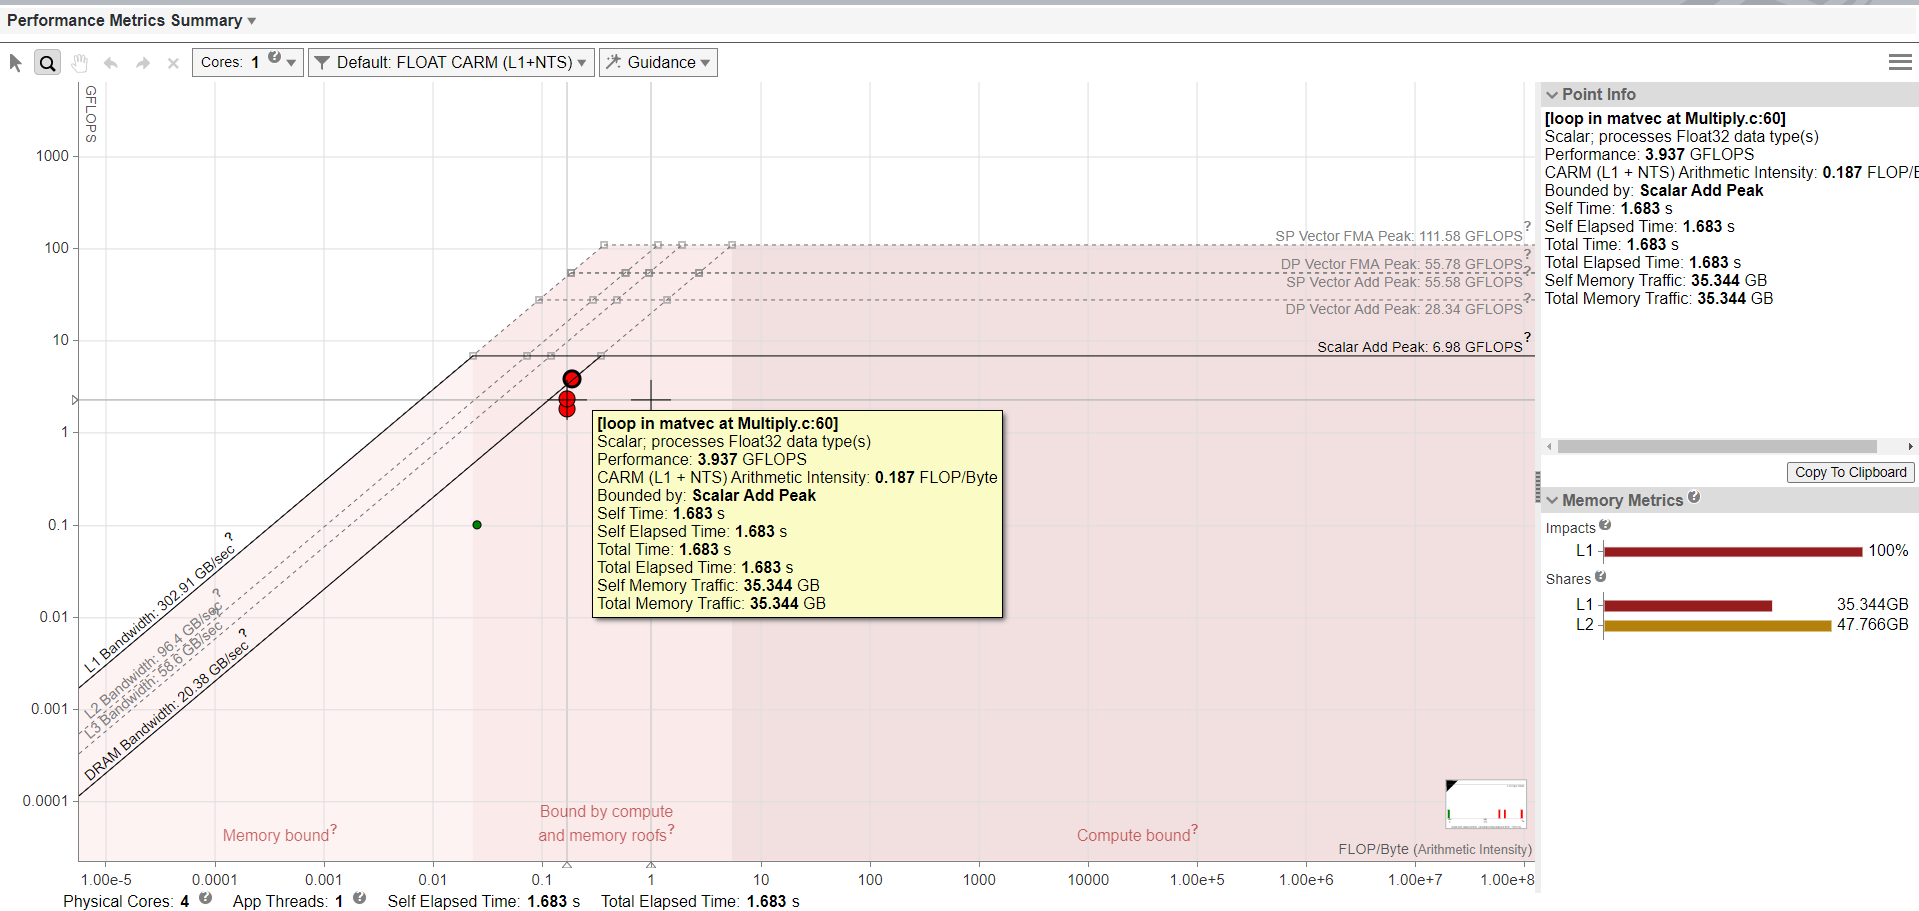
View an Interactive HTML Report
Intel Advisor enables you to export an interactive HTML report for the CPU Roofline chart, which you can open in your preferred browser and share.
When you open the report, you see the CPU Roofline chart with the selected configuration. In this report, you can:
Expand the Performance Metrics Summary drop-down to view the summary performance characteristics for your application.
Double-click a dot on the chart to see a roof ruler that point to exact roofs that bound the dot.
Hover over a dot to see a detailed tooltip with performance metrics.
If you have a Memory-level Roofline report, you can also:
Select memory levels to show dots for from the filter drop-down list on the chart.
Double-click a dot on the chart to expand it for other memory levels and see roof rulers.
For details on exporting HTML reports, see Work with Standalone HTML Reports.
Save a Read-only Snapshot
A snapshot is a read-only copy of a project result, which you can view at any time using the Intel Advisor GUI. You can save a snapshot for a project using Intel Advisor GUI or CLI.
To save an active project result as a read-only snapshot from GUI: Click the  button in the top ribbon of the report. In the Create a Result Snapshot dialog box, enter the snapshot details and save it.
To save an active project result as a read-only snapshot from CLI:
advisor --snapshot --project-dir=<project-dir> [--cache-sources] [--cache-binaries] -- <snapshot-path>
where:
- --cache-sources is an option to add application source code to the snapshot.
- --cache-binaries is an option to add application binaries to the snapshot.
- <snapshot-path is a path and a name for the snapshot. For example, if you specify /tmp/new_snapshot, a snapshot is saved in a tmp directory as new_snapshot.advixeexpz. You can skip this and save the snapshot to a current directory as snapshotXXX.advixeexpz.
To open the result snapshot in the Intel Advisor GUI, you can run the following command:
advisor-gui <snapshot-path>
You can visually compare the saved snapshot against the current active result or other snapshot results.
See Create a Read-only Result Snapshot for details.
Result Interpretation
When you run the CPU / Memory Roofline Insights perspective from GUI, depending on a configuration chosen, the chart shows a different level of details:
For a general overview of the report, see CPU Roofline Report Overview.
- CPU Roofline Report Overview
Review the controls available in the main report of the CPU / Memory Roofline Insights perspective of the Intel® Advisor. - Examine Bottlenecks on CPU Roofline Chart
- Examine Relationships Between Memory Levels
- Compare CPU Roofline Results
Use the Roofline Compare functionality to display Roofline chart data from other Intel® Advisor results or non-archived snapshots for comparison purposes to track optimization progress.