Profiling MPI Applications
This recipe uses Intel® VTune™ Profiler to identify imbalances and communications issues in MPI enabled applications, allowing you to improve the application performance.
Content expert: Carlos Rosales-fernandez
DIRECTIONS:
Ingredients
This section lists the hardware and software tools used for the performance analysis scenario.
Application: heart_demo sample application, available from GitHub* at https://github.com/CardiacDemo/Cardiac_demo.git
Tools:
Intel® C++ Compiler
Intel® MPI Library 2019
Intel VTune Profiler 2019
VTune Profiler - Application Performance Snapshot
NOTE:Intel MPI Library is available free of charge from https://software.intel.com/content/www/us/en/develop/tools/mpi-library.html.
- To download the latest version of VTune Profiler, go to the download page.
Operating system: Linux*
CPU: Intel® Xeon® Platinum 8168 Processor (formerly code named Skylake)
Network Fabric: Intel® Omni-Path Architecture (Intel® OPA)
Build Application
Build your application with debug symbols so VTune Profiler can correlate performance data with your source code and assembly.
Clone the application GitHub repository to your local system:
Set up the Intel C++ Compiler and Intel MPI Library environment:
In the root level of the sample package, create a build directory and change to that directory:
Build the application using the following command:
The executable heart_demo should be present in the current directory.
Establish Overall Performance Characteristics
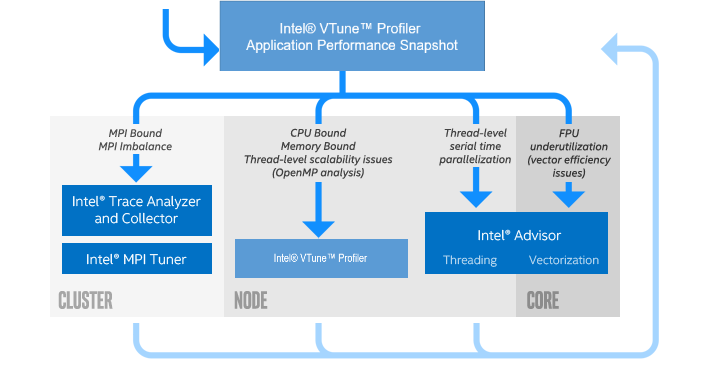
The recommended application tuning workflow using Intel software tools starts with obtaining a snapshot of your application performance and then focusing on the problematic areas using the most appropriate tool. VTune Profiler's Application Performance Snapshot provides overall performance characteristics of an application using a simple interface and a low overhead implementation. Use Application Performance Snapshot to gain an understanding of the general properties of your application before moving on to investigate specific issues in detail.
Let's obtain a performance snapshot on a set of dual socket nodes using the Intel® Xeon® Scalable processor (code named Skylake). This example uses Intel® Xeon® Platinum 8168 Processor with 24 cores per socket and configures the run to have 4 MPI ranks per node and 12 threads per rank. Modify the specific rank and thread counts in this example to match your own system specification.
Use the following command line on an interactive session or a batch script to obtain a performance snapshot on four nodes:
Once the analysis is complete, a directory named aps_result_YYYYMMDD is generated with the profiling data, where YYYY the year, MM the month, and DD the day of the collection. Run the following command to produce a single page HTML snapshot of the results:
The aps_report_YYYYMMDD_<stamp>.html file is created in your working directory, where the <stamp> number is used to prevent overwriting existing reports. The report contains information on overall performance, including MPI and OpenMP* imbalance, memory footprint and bandwidth utilization, and floating point throughput. A note at the top of the report highlights the main areas of concern for the application.
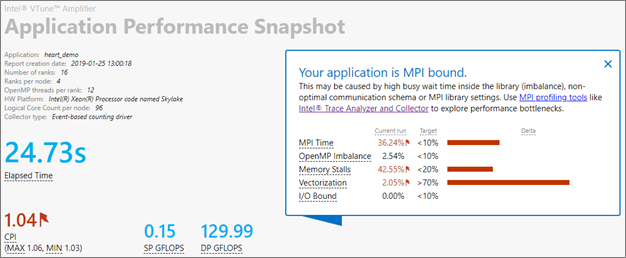
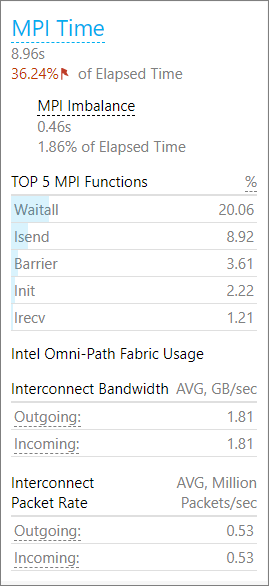
The snapshot indicates that overall this application is bound by MPI communication, but that it also suffers from memory and vectorization issues. The MPI Time section provides additional details, such as MPI imbalance and the top MPI function calls used. From the additional information it seems that the code uses mainly point to point communication and that the imbalance is moderate.
This snapshot result points to complex issues in the code. To continue investigating the performance issues and isolate the problems, use the HPC Performance Characterization analysis feature of VTune Profiler.
Configure and Run the HPC Performance Characterization Analysis
Most clusters are setup with login and compute nodes. Typically a user connects to a login node and uses a scheduler to submit a job to the compute nodes, where it executes. In a cluster environment, the most practical way of running VTune Profiler to profile an MPI application is to use the command line for data collection and the GUI for performance analysis once the job has completed.
Reporting on MPI-related metrics is simple from the command line. In general, the simplest way to execute in a distributed environment is by building a command as follows:
<mpi launcher> [options] amplxe-cl [options] -r <results dir> -- <application> [arguments]
NOTE:
- The command can be used in an interactive session or included in a batch submission script.
- The results directory specification is required for MPI applications.
- Add -trace-mpi if you are not using the Intel MPI Library.
Follow these steps to run the HPC Performance Characterization analysis from the command line:
Prepare your environment by sourcing the relevant VTune Profiler files. For a default installation using the bash shell, use the following command:
Collect data for the heart_demo application using the hpc-performance analysis. The application uses both OpenMP and MPI and will be executed using the configuration described earlier, with 16 MPI ranks over a total of 4 compute nodes using the Intel MPI Library. This example is run on Intel® Xeon® Platinum 8168 Processors and uses 12 OpenMP threads per MPI rank:
The analysis begins and generates four output directories using the following naming convention: vtune_mpi.<node host name>.
NOTE:You can select specific MPI ranks to be profiled while running others simultaneously, but without collecting profiling data. For details, see Selective MPI Rank Profiling.
Analyze Results using the VTune Profiler GUI
The VTune Profiler graphical interface provides a much richer and more interactive experience than the command line for analyzing the collected performance data. Start by running the following command to open one of the results in the VTune Profiler user interface:
NOTE:
To display the VTune Profiler GUI, an X11 manager running on the local system or a VNC session connected to the system is required. Each system is different, so consult with your local administrator for a recommended method.
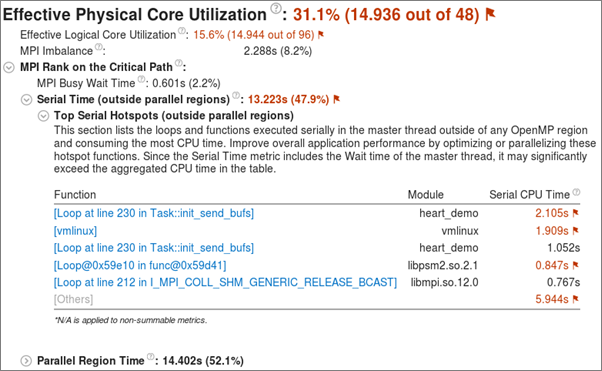
The result opens in VTune Amplifer and shows the Summary window, which provides an overview of the application performance. Because heart_demo is an MPI parallel application, the Summary window shows MPI Imbalance information and details regarding the MPI rank in the execution critical path in addition to the usual metrics.
- MPI Imbalance is an average MPI busy wait time by all ranks on the node. The value indicates how much time could be saved if balance was ideal.
- MPI Rank on the Critical Path is the rank with minimal busy wait time.
- MPI Busy Wait Time and Top Serial Hotspots are shown for the rank in the critical path. This is a good way to identify severe deficiencies in scalability since they typically correlate with high imbalance or busy wait metrics. Significant MPI Busy Wait Time for the rank on the critical path in a multi-node run might mean that the outlier rank is on a different node.
In our example, there is some imbalance and also a significant amount of time spent in serial regions of the code (not shown in the figure).
While profiles may be collected across nodes, the only way to view all MPI data is to load each node result independently. For detailed MPI traces Intel® Trace Analyzer and Collector is recommended.
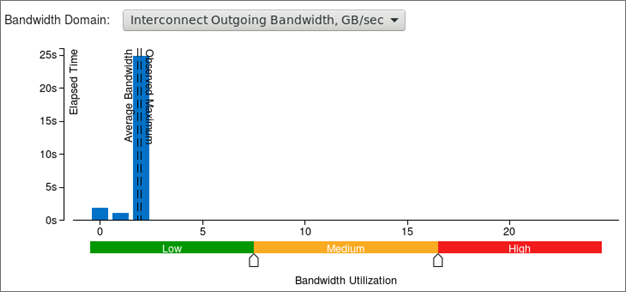
In Intel VTune Amplifer 2019 and higher the Summary window contains histograms of Intel® Omni-Path Architecture (Intel® OPA) fabric utilization. The metrics show bandwidth and packet rate and indicate what percentage of the execution time the code was bound by high bandwidth or packet rate utilization. VTune Profiler reports that the heart_demo application spends no time being bandwidth or packet rate bound, but the histogram shows a maximum bandwidth utilization of 1.8 GB/s that is close to the average. This hints to continuous, but inefficient, use of MPI communications.
Switch to the Bottom-up tab to get more details. Set the Grouping to have Process at the top level to get the following view:
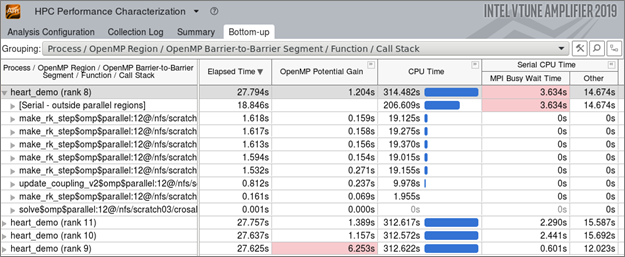
Since this code uses both MPI and OpenMP, the Bottom-up window shows metrics related to both runtimes besides the usual CPU and memory data. In our example, the MPI Busy Wait Time metric is shown in red for the MPI rank furthest from the critical path, which also shows the largest OpenMP potential gain. This hints that threading improvements could help performance.
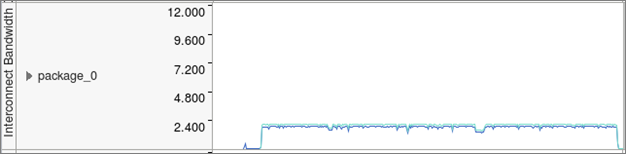
Review the execution timeline for several metrics at the bottom of the Bottom-up window, including DDR and MCDRAM bandwidth, as well as CPU time and Intel OPA utilization. The interconnect bandwidth timeline for this code shows continuous utilization at a moderate bandwidth (the scale is in GB/s). This could be due to regular MPI exchanges with small messages, which is a common mistake in distribute computing.
Of more interest is the detailed execution time per thread and the breakdown of Effective Time, Spin and Overhead Time, and MPI Busy Wait Times. The default view uses the Super Tiny settings to show all processes and threads together in a visual map of performance.
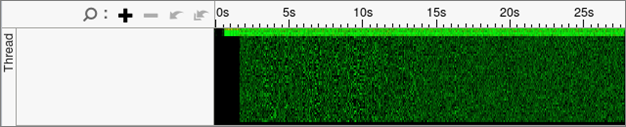
In this case you should see that there is little effective time in most of the threads (green) and that the amount of MPI overhead is also small (yellow). This points to potential issues in the threading implementation.
To investigate this in more detail, right-click on the grey area to the left of the graph to select the Rich view for the band height. Then, to the right of the graph, group results by Process/Thread so the roles of each MPI Rank and each thread are seen more clearly. By using this grouping, the top bar for each process shows the average result for all children threads and, below that average, each thread is listed with its own thread number and process ID.
In our example, the master thread clearly takes care of all MPI communication for each MPI rank, which is common in hybrid applications. A significant amount of time is spent in MPI communication (yellow) in the first ten seconds of the execution, likely to set up the problem and distribute data. After that there is regular MPI communication, which matches the results observed in the Bandwidth Utilization timeline and the Summary report.
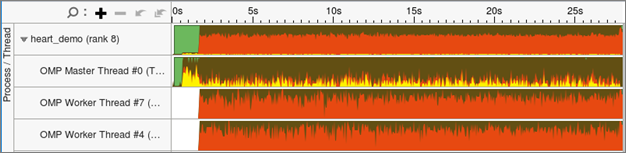
What is noticeable is the high amount of spin and overhead (shown in red by default), which indicates issues with the way threading was implemented in the application. At the top of the Bottom-up window, group the data by OpenMP Region / Thread / Function / Call Stack, and apply the filter at the bottom of the window to show Functions only. By expanding the tree, you can see that the function init_send_bufs is only called by thread 0 and is responsible for the low performance observed. Double clicking in the line brings up the source code viewer. Inspecting the code shows that there is a simple way to parallelize the outer loop in the function and fix this particular problem.
Generate a Command Line from the VTune Profiler GUI (optional)
A little known, but useful feature of VTune Profiler is the ability to configure an analysis using the GUI and then save the exact command line corresponding to it, so it can be used directly from the command line. This is convenient for heavily customized profiles or for quickly building a complex command.
- Launch VTune Profiler and click New Project or open an existing project.
- Click Configure Analysis.
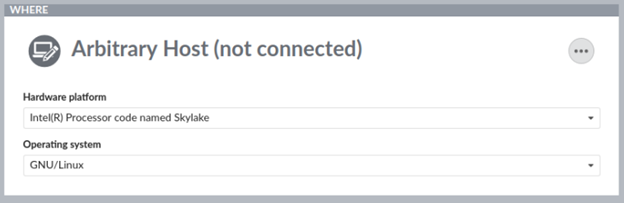
On the Where pane, select Arbitrary Host (not connected) and specify the hardware platform.
On the What pane:
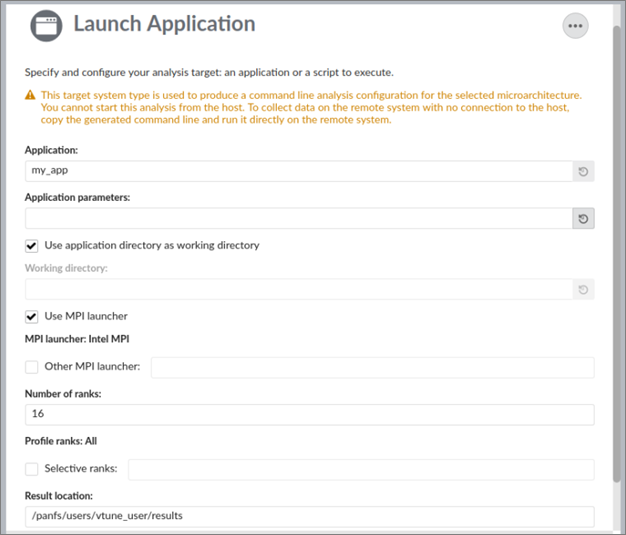
- Specify the application and set the parameters and working directory.
- Select the Use MPI launcher option and provide information related to the MPI run.
- [Optional] Choose particular ranks to profile.
On the How pane, change the default Hotspots analysis to HPC Performance Characterization and customize the available options.
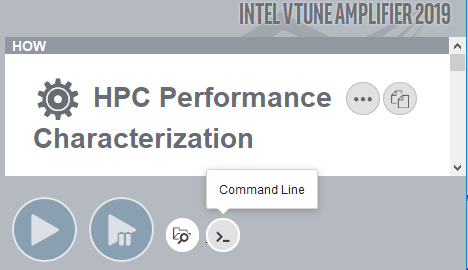
- Click the
 Command Line button at the bottom of the window. A pop-up window opens with the exact text corresponding to the command line you should use to perform the customize analysis you just configured on the GUI. Additional MPI options can be added to complete the command.
NOTE:
For Intel MPI, the command line is generated in terms of -gtool option, which allows to significantly simplify selective rank profiling syntax.
Analyze Results with a Command Line Report (optional)
VTune Profiler provides informative command line text reports. For example, to obtain a summary report, run the following command:
A summary of the results prints to the screen. Options to save the output directly to file and in other formats (csv, xml, html) are available, among many others. For details on the full command line options type amplxe-cl -help or consult the User Guide.
Selective Code Area Profiling (optional)
By default, VTune Profiler collects performance statistics for the whole application, but since version 2019 Update 3, it also provides the ability to control data collection for MPI applications. This has the advantage of generating smaller result files, which are faster to process, and to focus attention completely on a region of interest
The region selection process is done using the standard MPI_Pcontrol function. Call MPI_Pcontrol(0) to pause data collection and call MPI_Pcontrol(1) to resume it again. The API can be used together with the command line option -start-paused to exclude the application initialization phase. In this case, a MPI_Pcontrol(1) call should follow right after initialization to resume data collection. This method of controlling collection requires no changes in the application building process, unlike using ITT API calls, which require linking of a static ITT API library.
Additional Resources
- Intel Advisor Cookbook: Optimize Vectorization Aspects of a Real-Time 3D Cardiac Electrophysiology Simulation
- VTune Profiler Installation Guide for Linux
- Using Intel® Advisor and VTune Profiler with MPI
- Tutorial: Analyzing an OpenMP and MPI Application
NOTE:
Discuss this recipe in the developer forum
Product and Performance Information |
|---|
Performance varies by use, configuration and other factors. Learn more at www.Intel.com/PerformanceIndex. Notice revision #20201201 |
Parent topic: Configuration Recipes